33
/it/
AIzaSyB4mHJ5NPEv-XzF7P6NDYXjlkCWaeKw5bc
November 30, 2025
265258
Togo
TGO
true
2
1
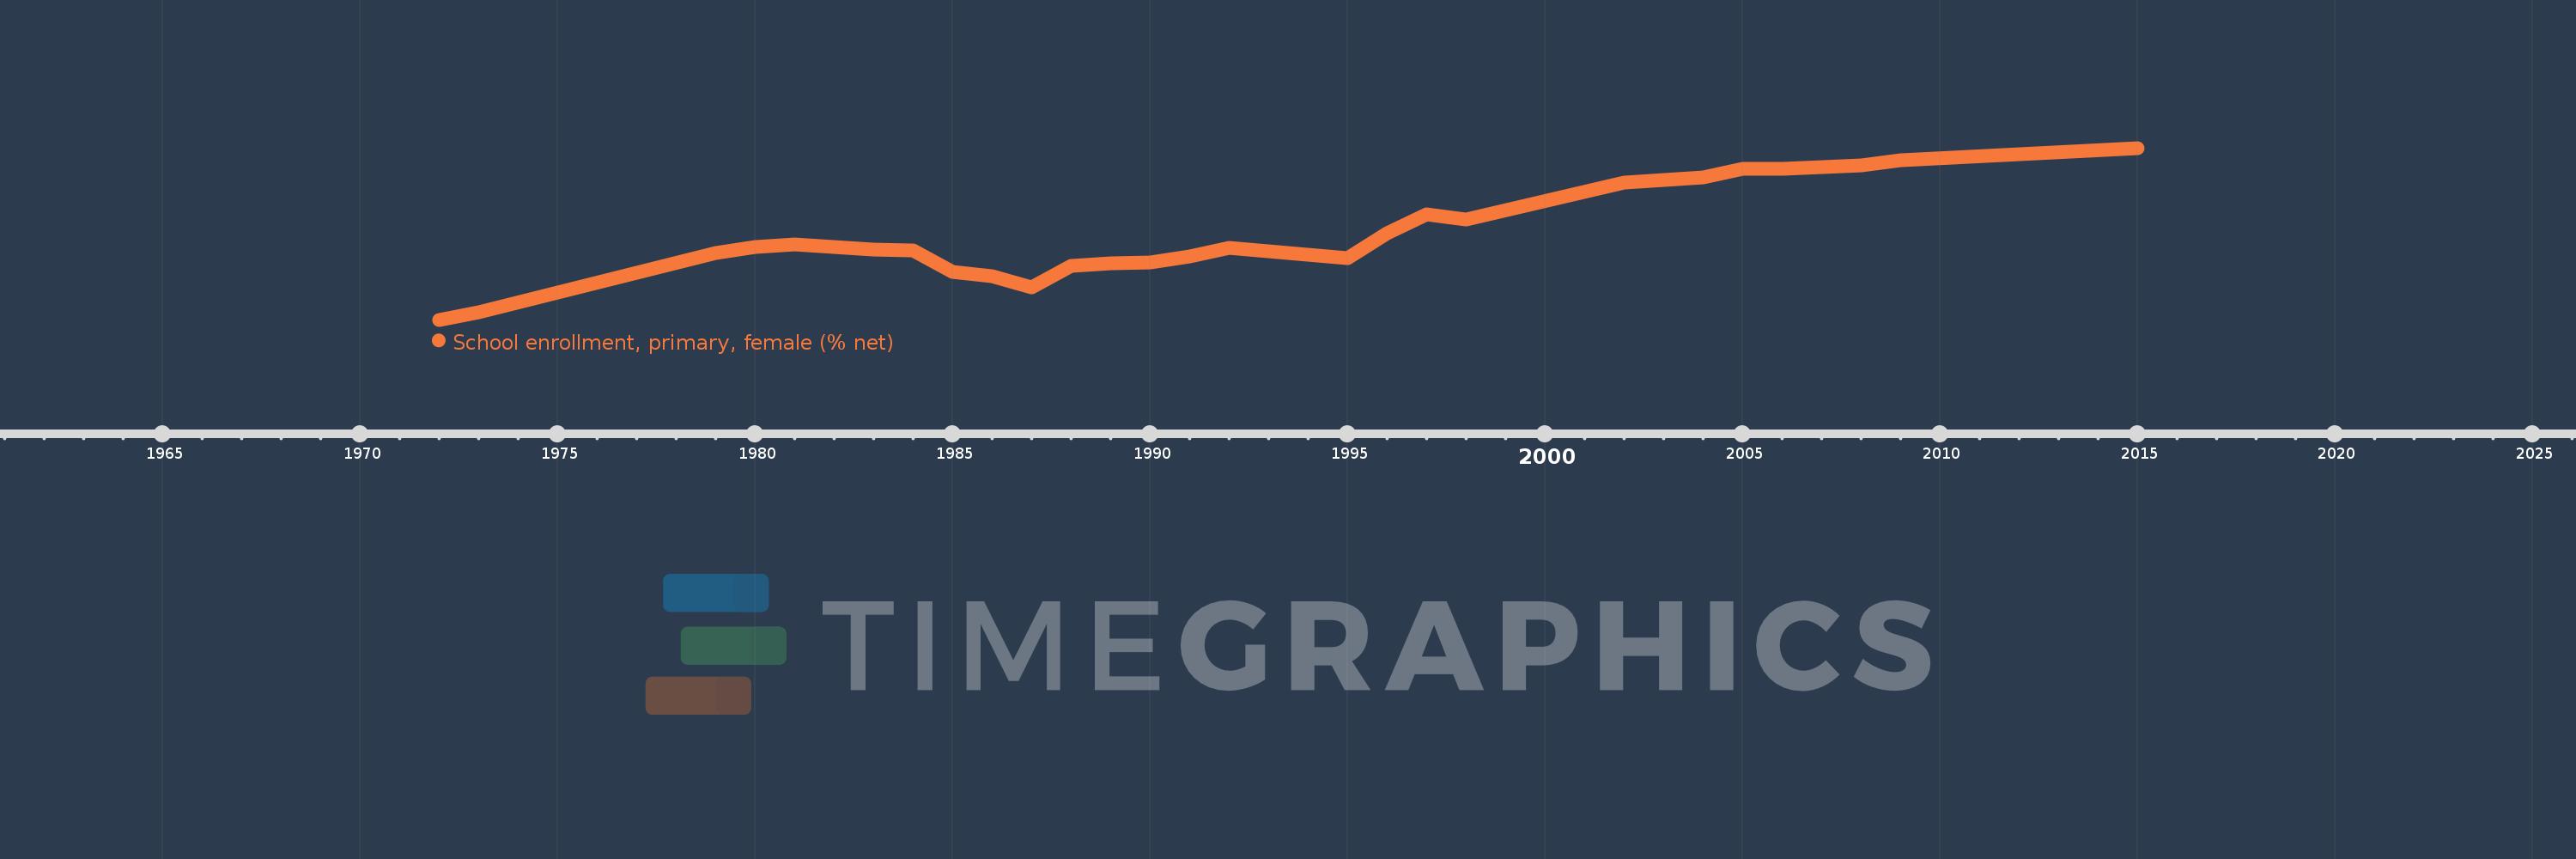
School enrollment, primary, female (% net)
2015,2009,2008,2006,2005,2004,2002,1998,1997,1996,1995,1992,1991,1990,1989,1988,1987,1986,1985,1984,1983,1981,1980,1979,1973,1972