29
/it/
it
AIzaSyAYiBZKx7MnpbEhh9jyipgxe19OcubqV5w
April 1, 2024
170468
Korea, Rep.
KOR
true
2
1
School enrollment, primary, female (% net)
2014,2013,2012,2011,2010,2009,2008,2003,2002,2001,2000,1999,1987,1986,1985,1980,1979,1978,1977,1976,1975,1974,1973,1972
Download
Biblioteca di statistiche globali →Korea, Rep. →

School enrollment, primary, female (% net)

Queste statistiche in altri paesi:
AfghanistanAlbaniaAlgeriaAngolaAntigua and BarbudaArab WorldArgentinaArmeniaArubaAustraliaAustriaAzerbaijanBahamas, TheBahrainBangladeshBarbadosBelarusBelgiumBelizeBeninBermudaBhutanBoliviaBosnia and HerzegovinaBotswanaBrazilBrunei DarussalamBulgariaBurkina FasoBurundiCabo VerdeCambodiaCameroonCanadaCaribbean small statesCentral African RepublicCentral Europe and the BalticsChadChileChinaColombiaComorosCongo, Dem. Rep.Congo, Rep.Costa RicaCote d'IvoireCroatiaCubaCyprusDenmarkDjiboutiDominicaDominican RepublicEarly-demographic dividendEast Asia & PacificEast Asia & Pacific (excluding high income)East Asia & Pacific (IDA & IBRD countries)EcuadorEgypt, Arab Rep.El SalvadorEquatorial GuineaEritreaEstoniaEthiopiaEuro areaEurope & Central AsiaEurope & Central Asia (excluding high income)Europe & Central Asia (IDA & IBRD countries)European UnionFijiFinlandFragile and conflict affected situationsFranceGabonGambia, TheGeorgiaGhanaGreeceGrenadaGuatemalaGuineaGuinea-BissauGuyanaHaitiHeavily indebted poor countries (HIPC)High incomeHondurasHong Kong SAR, ChinaHungaryIBRD onlyIcelandIDA & IBRD totalIDA blendIDA onlyIDA totalIndiaIndonesiaIran, Islamic Rep.IraqIrelandIsraelItalyJamaicaJapanJordanKazakhstanKenyaKiribatiKorea, Dem. People’s Rep.Korea, Rep.KuwaitKyrgyz RepublicLao PDRLate-demographic dividendLatin America & Caribbean Latin America & Caribbean (excluding high income)Latin America & the Caribbean (IDA & IBRD countries)LatviaLeast developed countries: UN classificationLebanonLesothoLiberiaLibyaLiechtensteinLithuaniaLow & middle incomeLow incomeLower middle incomeLuxembourgMacao SAR, ChinaMacedonia, FYRMadagascarMalawiMaldivesMaliMaltaMarshall IslandsMauritaniaMauritiusMexicoMicronesia, Fed. Sts.Middle East & North AfricaMiddle East & North Africa (excluding high income)Middle East & North Africa (IDA & IBRD countries)Middle incomeMoldovaMongoliaMontenegroMoroccoMozambiqueMyanmarNamibiaNauruNepalNetherlandsNew ZealandNicaraguaNigerNigeriaNorth AmericaNorwayOECD membersOmanOther small statesPacific island small statesPakistanPanamaPapua New GuineaParaguayPeruPhilippinesPolandPortugalPost-demographic dividendPre-demographic dividendPuerto RicoQatarRomaniaRussian FederationRwandaSamoaSan MarinoSao Tome and PrincipeSaudi ArabiaSenegalSerbiaSeychellesSierra LeoneSloveniaSmall statesSolomon IslandsSomaliaSouth AfricaSouth AsiaSouth Asia (IDA & IBRD)South SudanSpainSri LankaSt. Kitts and NevisSt. LuciaSt. Vincent and the GrenadinesSub-Saharan Africa Sub-Saharan Africa (excluding high income)Sub-Saharan Africa (IDA & IBRD countries)SudanSurinameSwazilandSwedenSwitzerlandSyrian Arab RepublicTajikistanTanzaniaThailandTimor-LesteTogoTongaTrinidad and TobagoTunisiaTurkeyTuvaluUgandaUkraineUnited Arab EmiratesUnited KingdomUnited StatesUpper middle incomeUruguayUzbekistanVanuatuVenezuela, RBWest Bank and GazaWorldYemen, Rep.ZambiaZimbabwe
Linea del tempo:
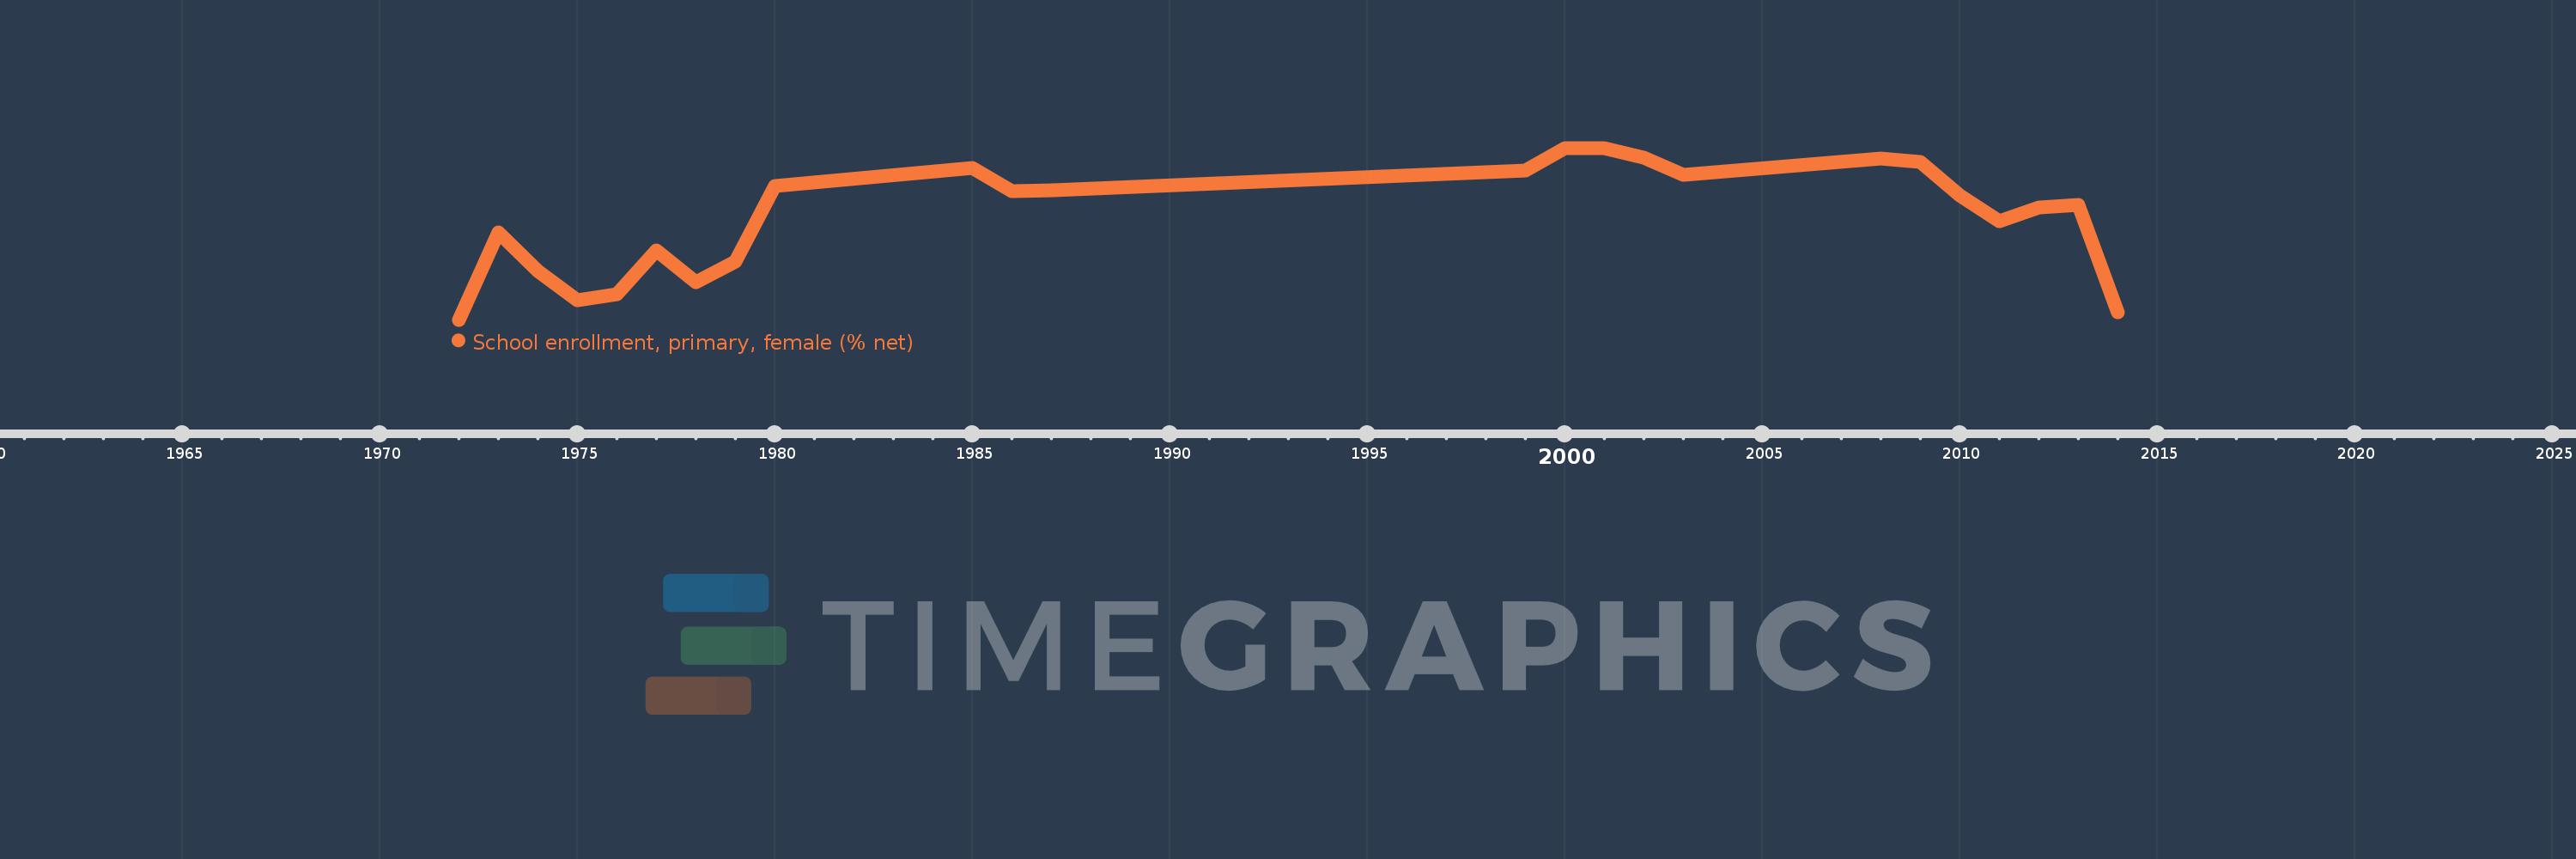
Questa scala temporale mostra un grafico dal 1972 anno al 2014 anno. Korea, Rep.. I dati fino ad 1971 anno non disponibili. Il numero di osservazioni attuali secondo i date: 24.
La fonte (nome):
Indicatori dello sviluppo mondiale
La fonte (organizzazione):
United Nations Educational, Scientific, and Cultural Organization (UNESCO) Institute for Statistics.
Categorie:
Education, Gender
sono stati aggiornati
23 apr 2017 anni
Indicatori delle variazioni dei valori per anni
In media:
98.225
Minima:
95.804
1 gen 1972 anni
Massimo:
99.853
1 gen 2001 anni
Alla data di osservazione
Valore
Variazione assoluta
La variazione rispetto al valore precedente
1 gen 1972 anni
95.804
+95.804
0.0%
1 gen 1973 anni
97.861
+2.057
2.15%
1 gen 1974 anni
96.947
-0.913
-0.93%
1 gen 1975 anni
96.271
-0.677
-0.7%
1 gen 1976 anni
96.401
+0.13
0.14%
1 gen 1977 anni
97.442
+1.041
1.08%
1 gen 1978 anni
96.687
-0.755
-0.78%
1 gen 1979 anni
97.182
+0.495
0.51%
1 gen 1980 anni
98.947
+1.765
1.82%
1 gen 1985 anni
99.378
+0.431
0.44%
1 gen 1986 anni
98.843
-0.535
-0.54%
1 gen 1987 anni
98.85
+0.007
0.01%
1 gen 1999 anni
99.327
+0.477
0.48%
1 gen 2000 anni
99.85
+0.523
0.53%
1 gen 2001 anni
99.853
+0.003
0.0%
1 gen 2002 anni
99.63
-0.223
-0.22%
1 gen 2003 anni
99.211
-0.419
-0.42%
1 gen 2008 anni
99.598
+0.387
0.39%
1 gen 2009 anni
99.516
-0.082
-0.08%
1 gen 2010 anni
98.724
-0.792
-0.8%
1 gen 2011 anni
98.131
-0.593
-0.6%
1 gen 2012 anni
98.454
+0.323
0.33%
1 gen 2013 anni
98.503
+0.049
0.05%
1 gen 2014 anni
95.986
-2.517
-2.56%
Classificazione dei paesi secondo i statistiche attuali per anni

Commenti:

Inviare
PremiumAbout & FeedbackAccordoPrivatezza
logo
© 2022 Selected Technologies LLC – Morgan Hill, California