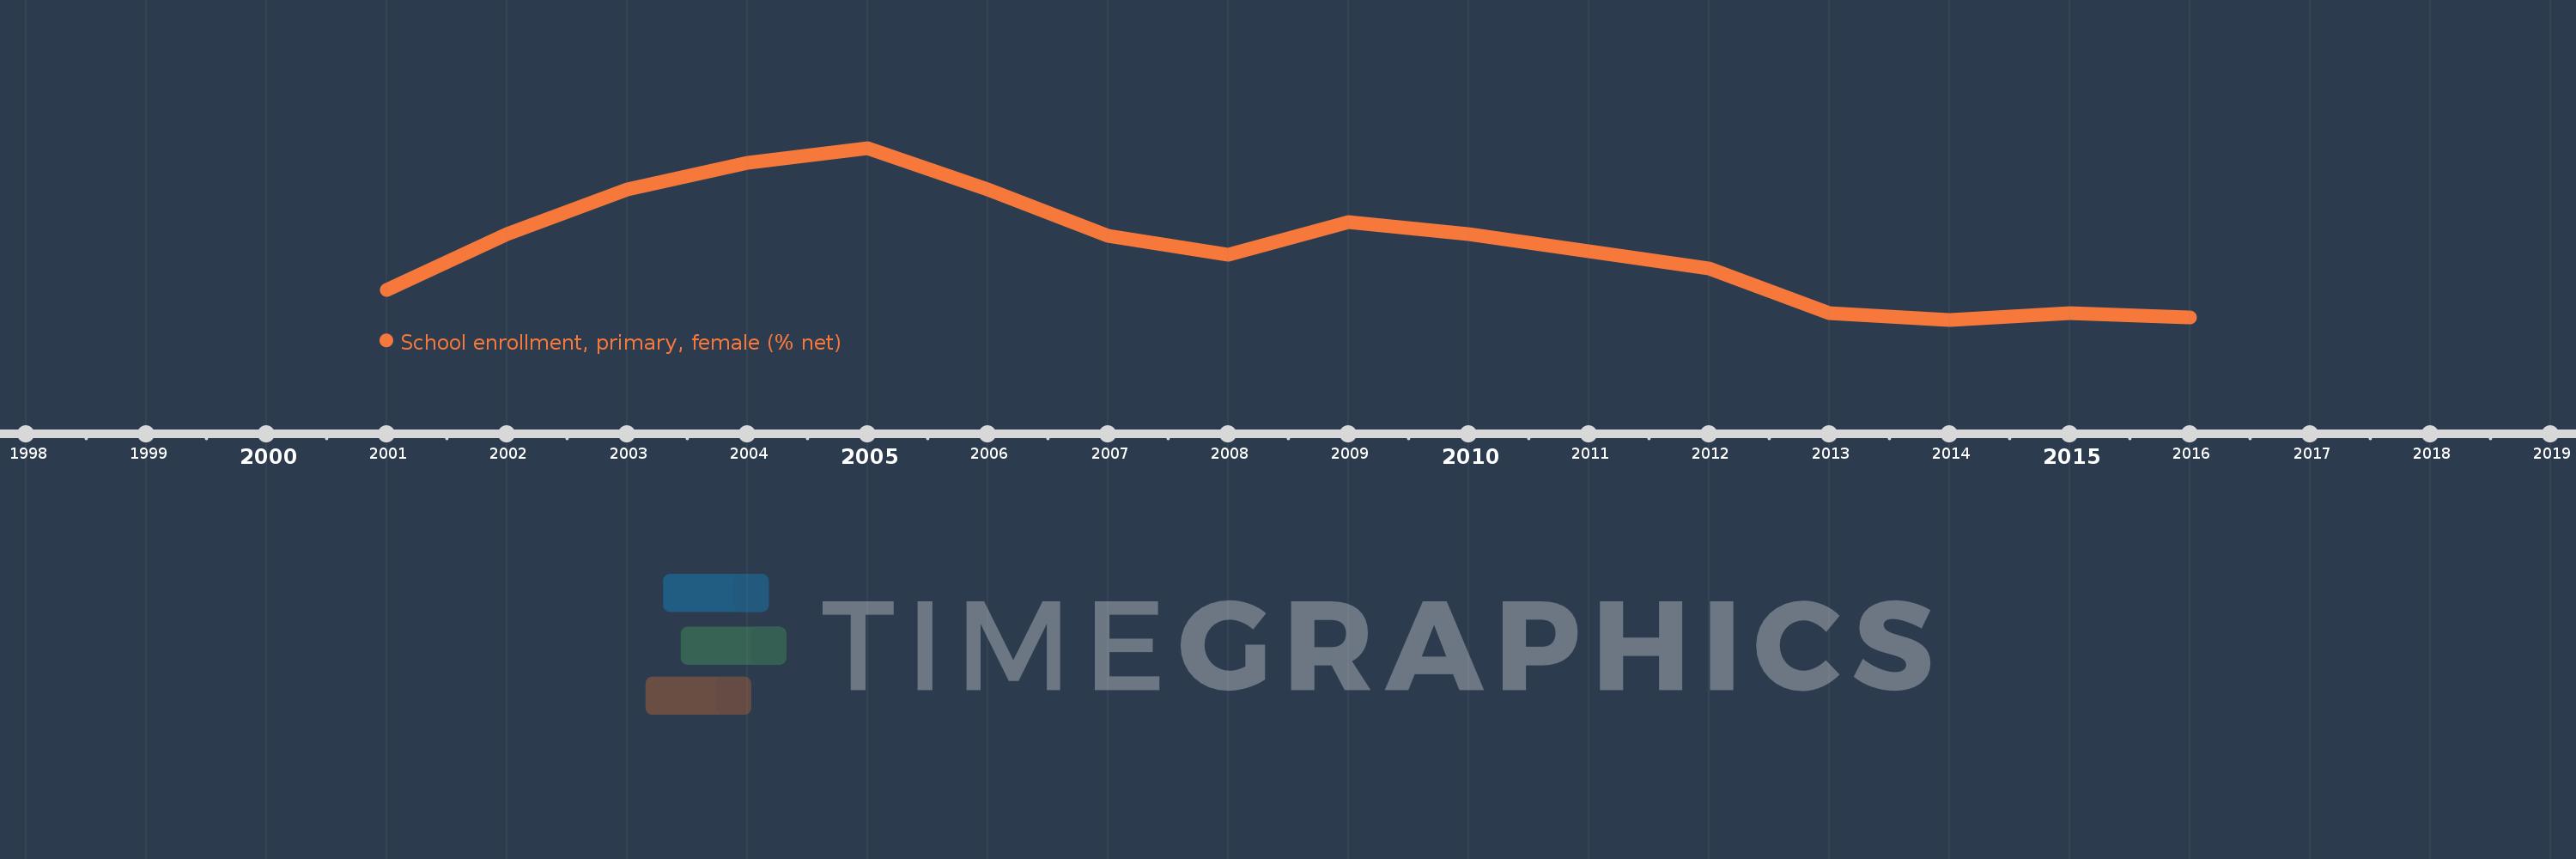
Questa scala temporale mostra un grafico dal 2001 anno al 2016 anno. Kazakhstan. I dati fino ad 2000 anno non disponibili. Il numero di osservazioni attuali secondo i date: 15.
La fonte (nome):
Indicatori dello sviluppo mondiale
La fonte (organizzazione):
United Nations Educational, Scientific, and Cultural Organization (UNESCO) Institute for Statistics.
Categorie:
Education, Gender
sono stati aggiornati
23 apr 2017 anni
Indicatori delle variazioni dei valori per anni
In media:
88.541
Minima:
85.73
1 gen 2014 anni
Massimo:
92.294
1 gen 2005 anni
Alla data di osservazione
Valore
Variazione assoluta
La variazione rispetto al valore precedente
1 gen 2001 anni
86.865
+86.865
0.0%
1 gen 2002 anni
88.998
+2.133
2.46%
1 gen 2003 anni
90.716
+1.718
1.93%
1 gen 2004 anni
91.711
+0.995
1.1%
1 gen 2005 anni
92.294
+0.583
0.64%
1 gen 2006 anni
90.7
-1.593
-1.73%
1 gen 2007 anni
88.942
-1.759
-1.94%
1 gen 2008 anni
88.228
-0.713
-0.8%
1 gen 2009 anni
89.462
+1.233
1.4%
1 gen 2010 anni
89.0
-0.462
-0.52%
1 gen 2012 anni
87.689
-1.31
-1.47%
1 gen 2013 anni
85.967
-1.723
-1.96%
1 gen 2014 anni
85.73
-0.237
-0.28%
1 gen 2015 anni
85.997
+0.266
0.31%
1 gen 2016 anni
85.812
-0.185
-0.21%
Classificazione dei paesi secondo i statistiche attuali per anni