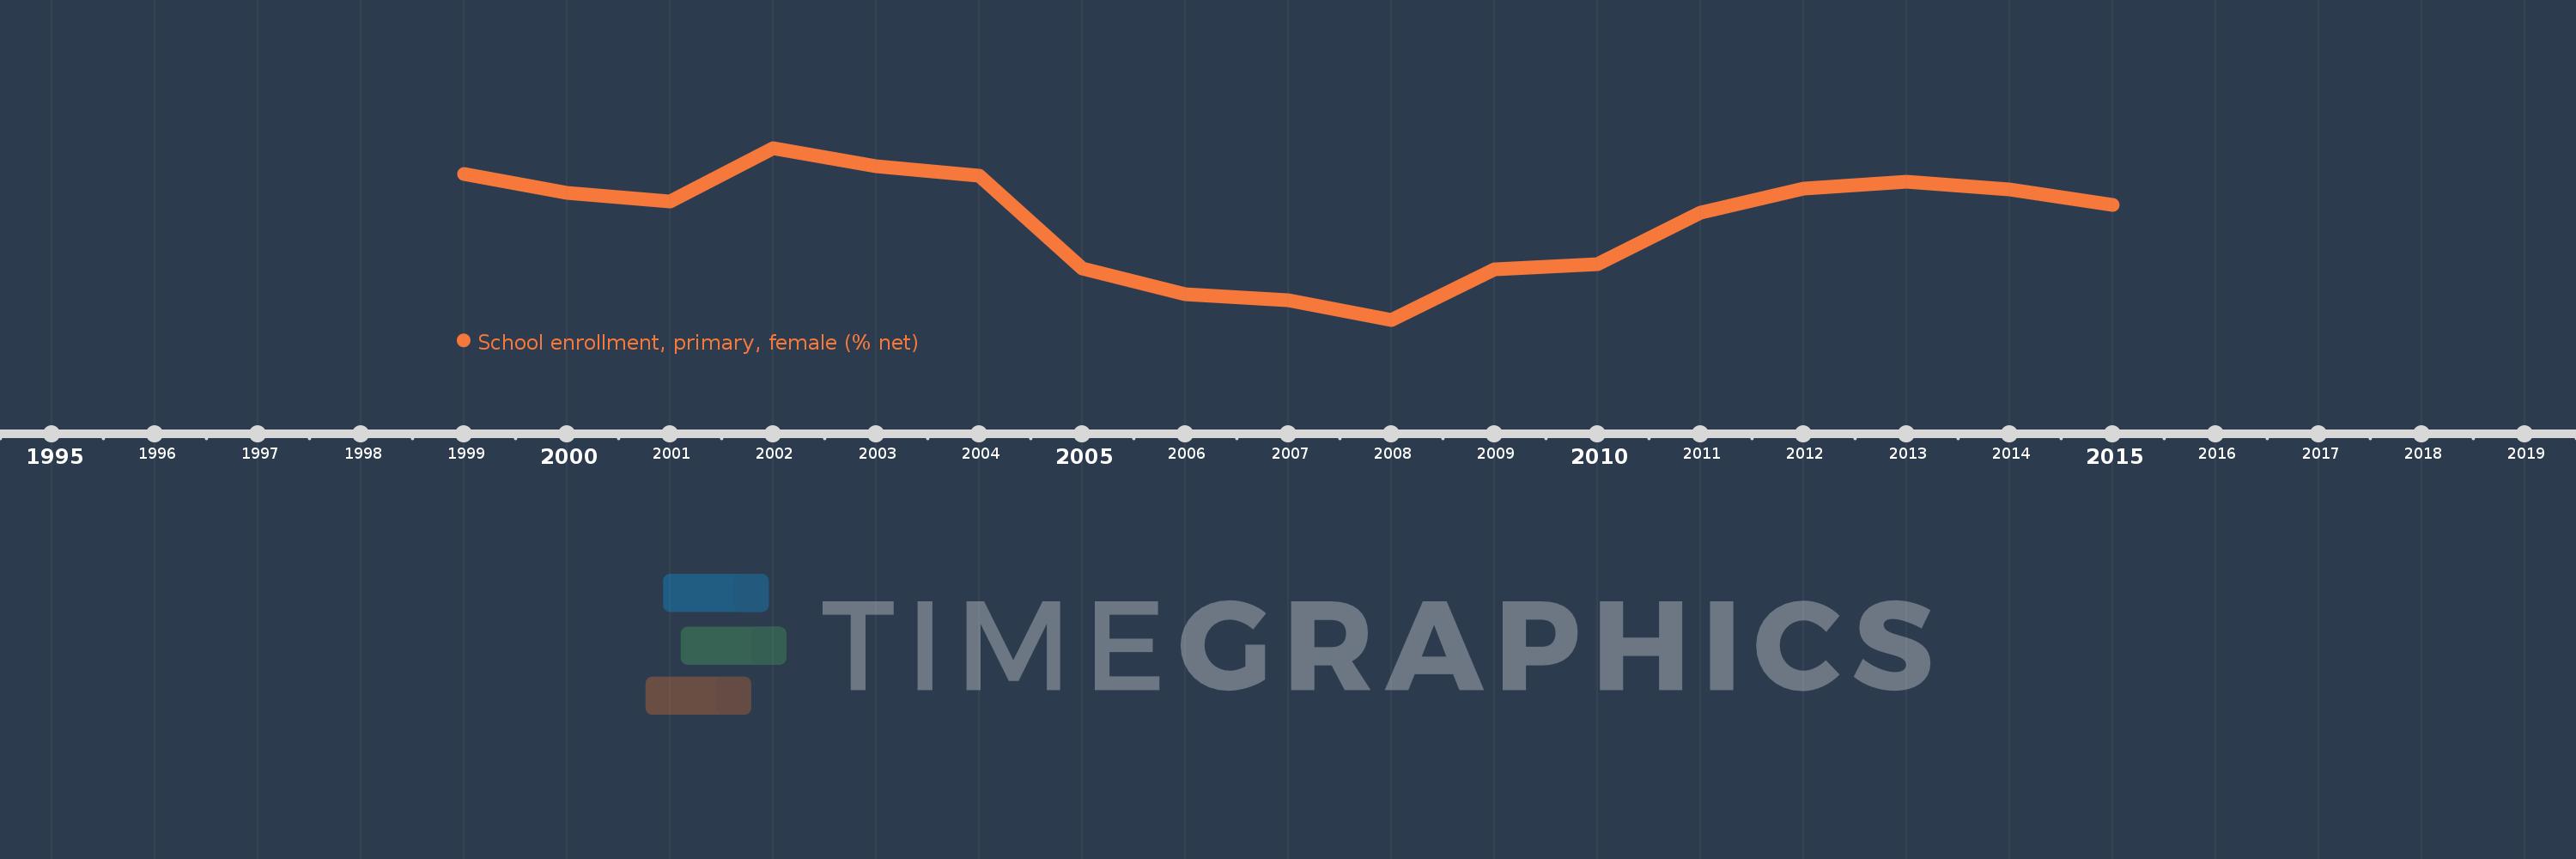
Questa scala temporale mostra un grafico dal 1999 anno al 2015 anno. European Union. I dati fino ad 1998 anno non disponibili. Il numero di osservazioni attuali secondo i date: 17.
La fonte (nome):
Indicatori dello sviluppo mondiale
La fonte (organizzazione):
United Nations Educational, Scientific, and Cultural Organization (UNESCO) Institute for Statistics.
Categorie:
Education, Gender
sono stati aggiornati
23 apr 2017 anni
Indicatori delle variazioni dei valori per anni
In media:
97.51
Minima:
96.996
1 gen 2008 anni
Massimo:
97.887
1 gen 2002 anni
Alla data di osservazione
Valore
Variazione assoluta
La variazione rispetto al valore precedente
1 gen 1999 anni
97.752
+97.752
0.0%
1 gen 2000 anni
97.656
-0.096
-0.1%
1 gen 2001 anni
97.61
-0.046
-0.05%
1 gen 2002 anni
97.887
+0.277
0.28%
1 gen 2003 anni
97.792
-0.095
-0.1%
1 gen 2004 anni
97.741
-0.051
-0.05%
1 gen 2005 anni
97.262
-0.479
-0.49%
1 gen 2006 anni
97.128
-0.134
-0.14%
1 gen 2007 anni
97.095
-0.033
-0.03%
1 gen 2008 anni
96.996
-0.099
-0.1%
1 gen 2009 anni
97.257
+0.261
0.27%
1 gen 2010 anni
97.285
+0.027
0.03%
1 gen 2011 anni
97.552
+0.267
0.27%
1 gen 2012 anni
97.677
+0.125
0.13%
1 gen 2013 anni
97.71
+0.033
0.03%
1 gen 2014 anni
97.673
-0.038
-0.04%
1 gen 2015 anni
97.592
-0.081
-0.08%
Classificazione dei paesi secondo i statistiche attuali per anni