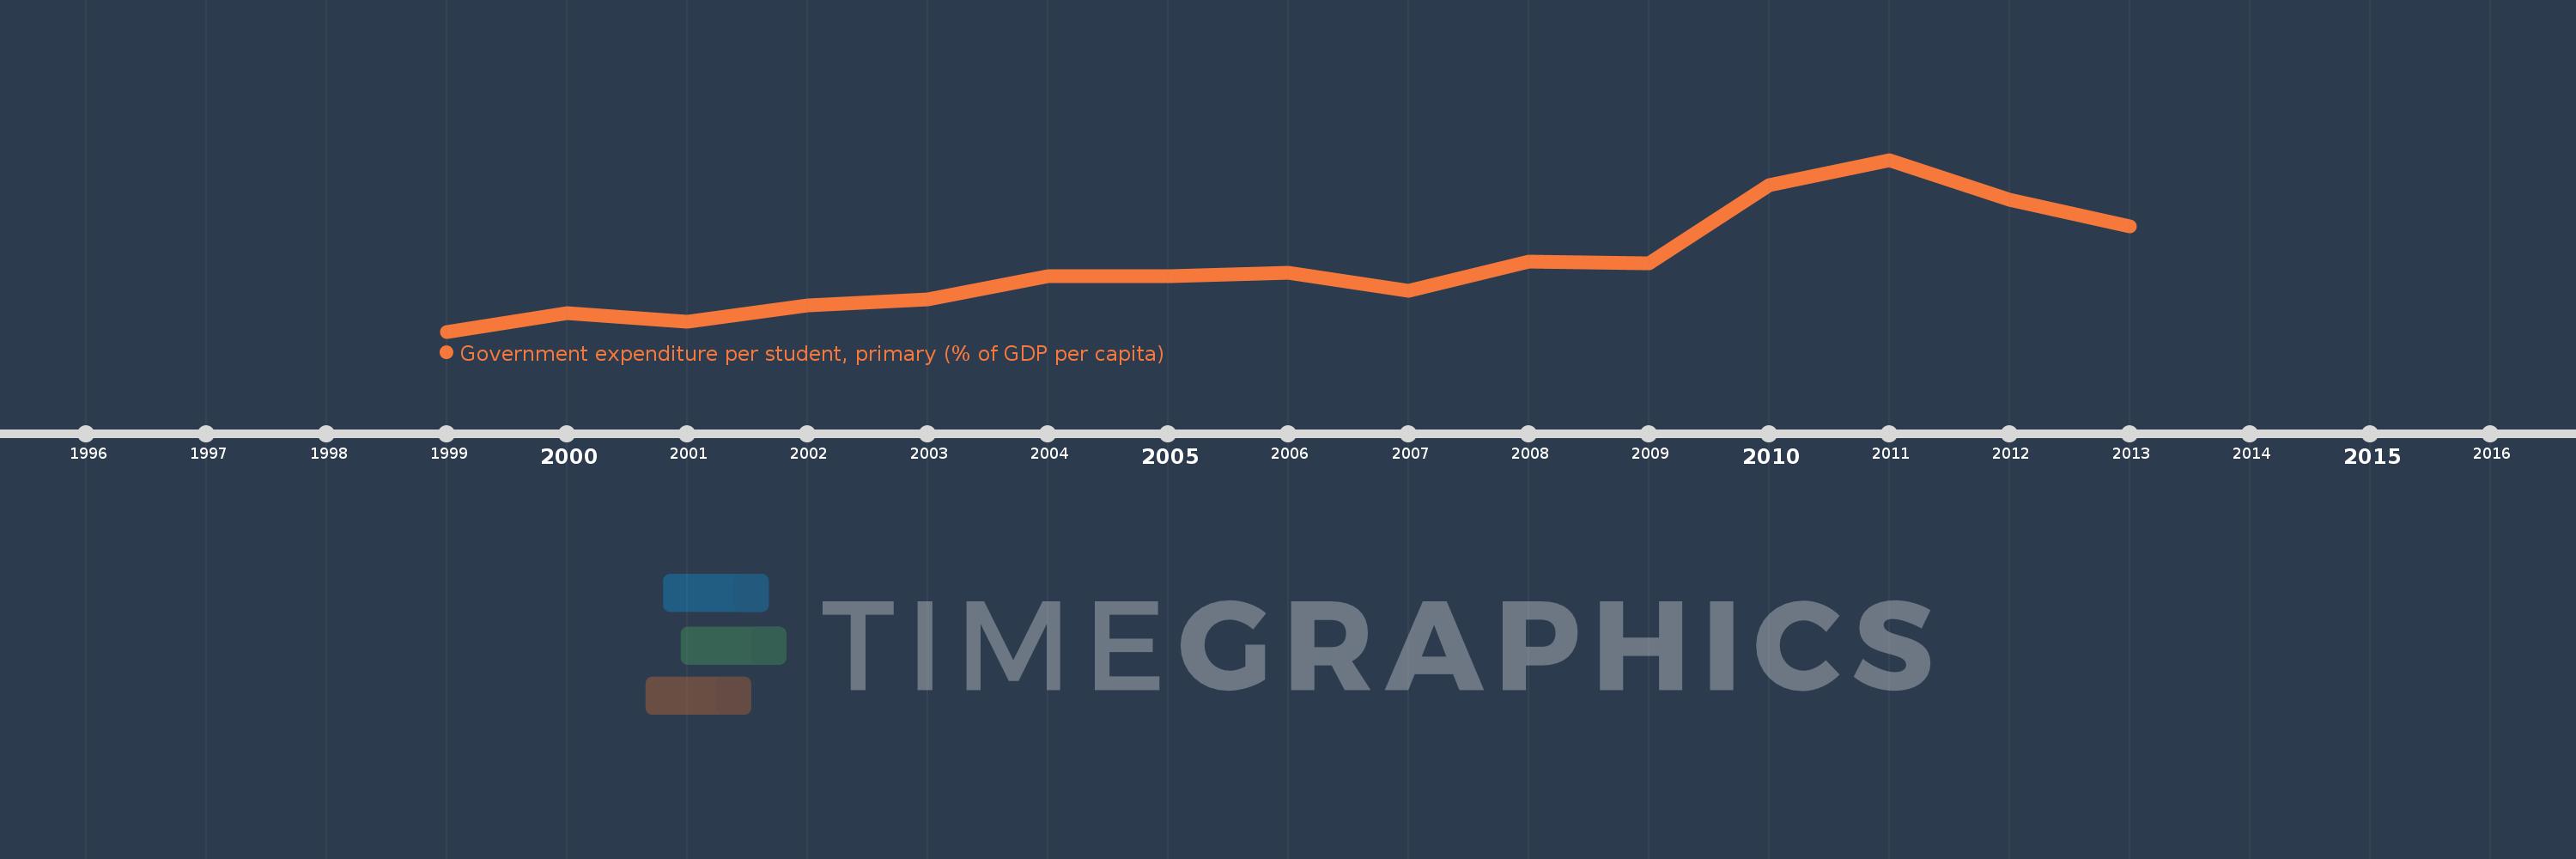
Questa scala temporale mostra un grafico dal 1999 anno al 2013 anno. Euro area. I dati fino ad 1998 anno non disponibili. Il numero di osservazioni attuali secondo i date: 15.
La fonte (nome):
Indicatori dello sviluppo mondiale
La fonte (organizzazione):
United Nations Educational, Scientific, and Cultural Organization (UNESCO) Institute for Statistics.
Categorie:
Education
sono stati aggiornati
23 apr 2017 anni
Indicatori delle variazioni dei valori per anni
In media:
18.921
Minima:
16.984
1 gen 1999 anni
Massimo:
22.019
1 gen 2011 anni
Alla data di osservazione
Valore
Variazione assoluta
La variazione rispetto al valore precedente
1 gen 1999 anni
16.984
+16.984
0.0%
1 gen 2000 anni
17.53
+0.546
3.22%
1 gen 2001 anni
17.273
-0.258
-1.47%
1 gen 2002 anni
17.755
+0.482
2.79%
1 gen 2003 anni
17.926
+0.171
0.96%
1 gen 2004 anni
18.613
+0.687
3.83%
1 gen 2005 anni
18.62
+0.008
0.04%
1 gen 2006 anni
18.7
+0.08
0.43%
1 gen 2007 anni
18.173
-0.528
-2.82%
1 gen 2008 anni
19.041
+0.868
4.78%
1 gen 2009 anni
18.973
-0.067
-0.35%
1 gen 2010 anni
21.276
+2.303
12.14%
1 gen 2011 anni
22.019
+0.743
3.49%
1 gen 2012 anni
20.86
-1.159
-5.26%
1 gen 2013 anni
20.079
-0.781
-3.75%
Classificazione dei paesi secondo i statistiche attuali per anni