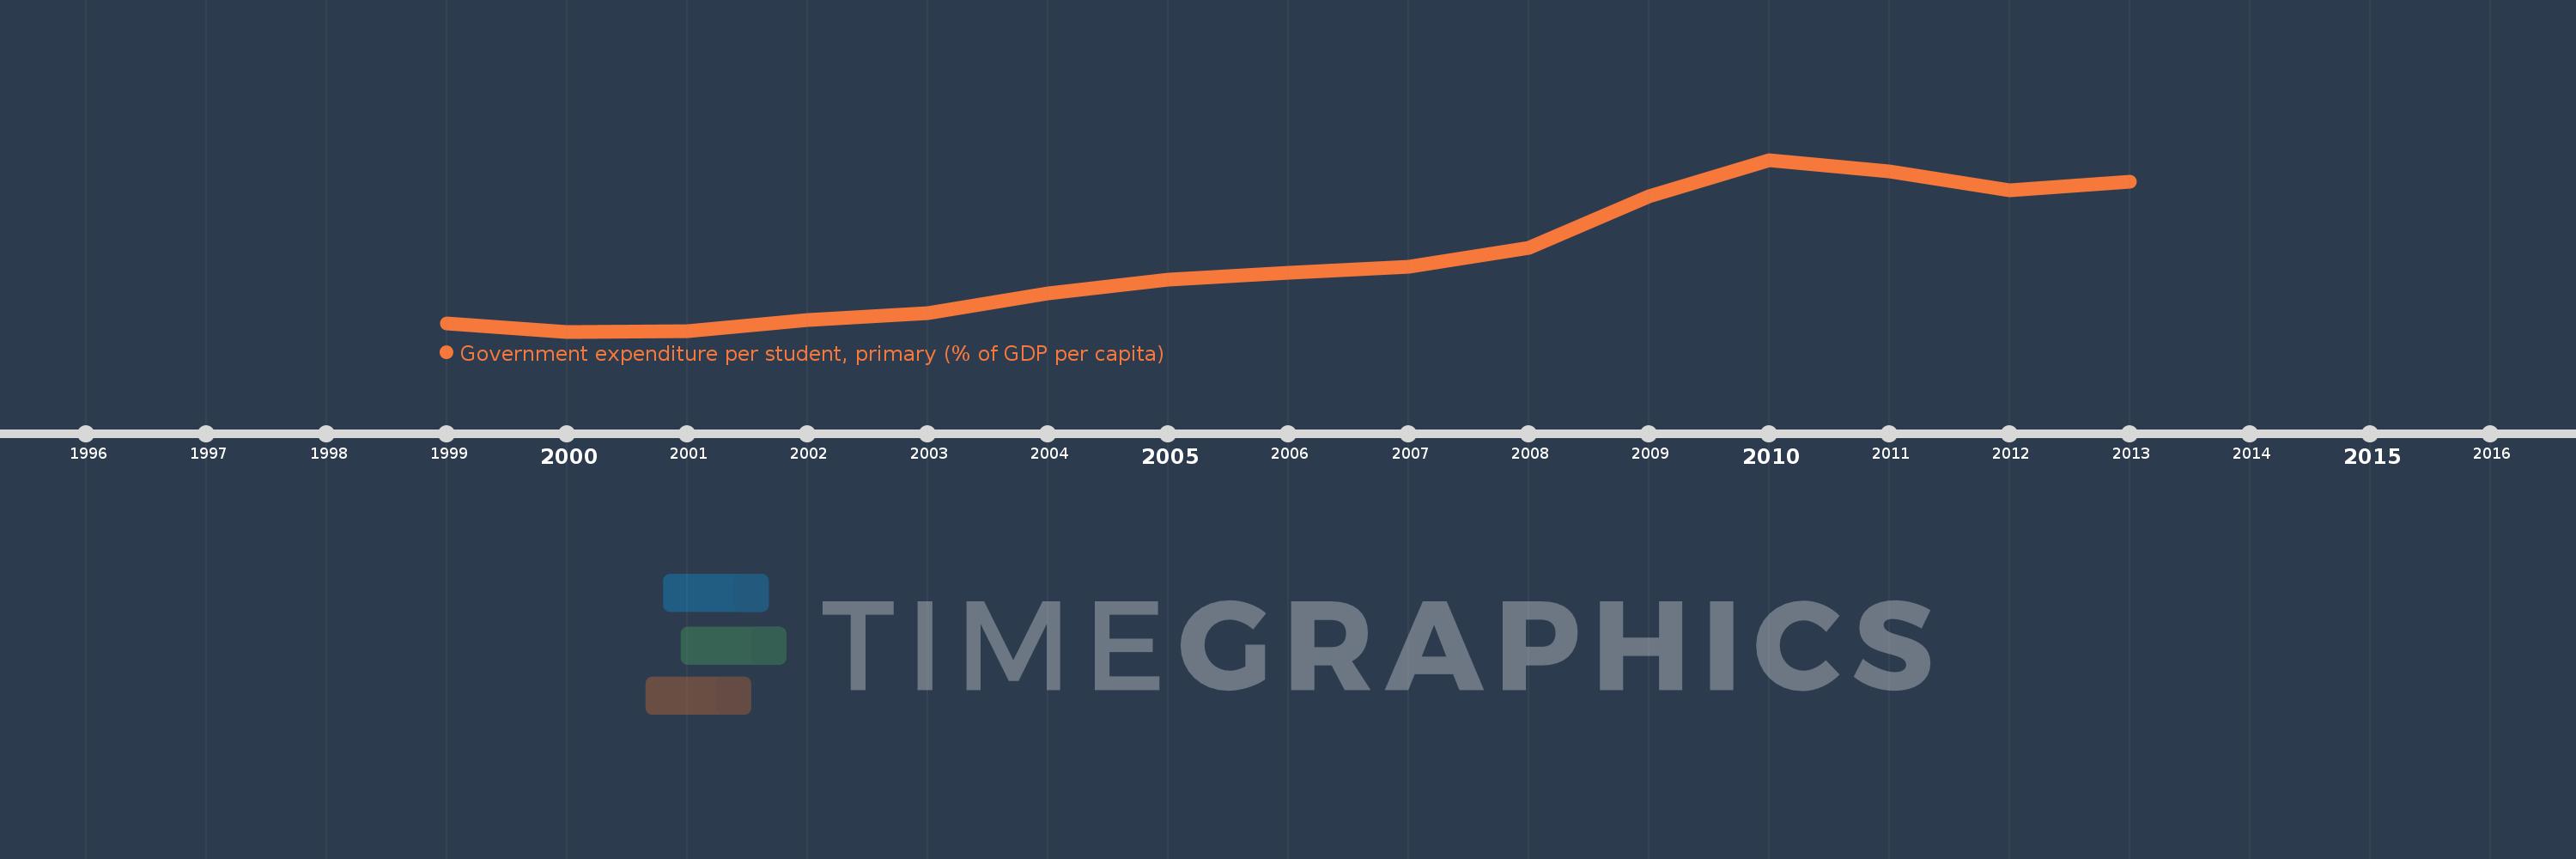
Questa scala temporale mostra un grafico dal 1999 anno al 2013 anno. Ireland. I dati fino ad 1998 anno non disponibili. Il numero di osservazioni attuali secondo i date: 15.
La fonte (nome):
Indicatori dello sviluppo mondiale
La fonte (organizzazione):
United Nations Educational, Scientific, and Cultural Organization (UNESCO) Institute for Statistics.
Categorie:
Education
sono stati aggiornati
23 apr 2017 anni
Indicatori delle variazioni dei valori per anni
In media:
14.706
Minima:
10.766
1 gen 2000 anni
Massimo:
20.023
1 gen 2010 anni
Alla data di osservazione
Valore
Variazione assoluta
La variazione rispetto al valore precedente
1 gen 1999 anni
11.204
+11.204
0.0%
1 gen 2000 anni
10.766
-0.438
-3.91%
1 gen 2001 anni
10.799
+0.033
0.31%
1 gen 2002 anni
11.397
+0.598
5.54%
1 gen 2003 anni
11.775
+0.378
3.32%
1 gen 2004 anni
12.814
+1.039
8.82%
1 gen 2005 anni
13.584
+0.77
6.01%
1 gen 2006 anni
13.957
+0.373
2.74%
1 gen 2007 anni
14.26
+0.303
2.17%
1 gen 2008 anni
15.286
+1.026
7.2%
1 gen 2009 anni
18.071
+2.785
18.22%
1 gen 2010 anni
20.023
+1.952
10.8%
1 gen 2011 anni
19.4
-0.622
-3.11%
1 gen 2012 anni
18.389
-1.011
-5.21%
1 gen 2013 anni
18.859
+0.47
2.56%
Classificazione dei paesi secondo i statistiche attuali per anni