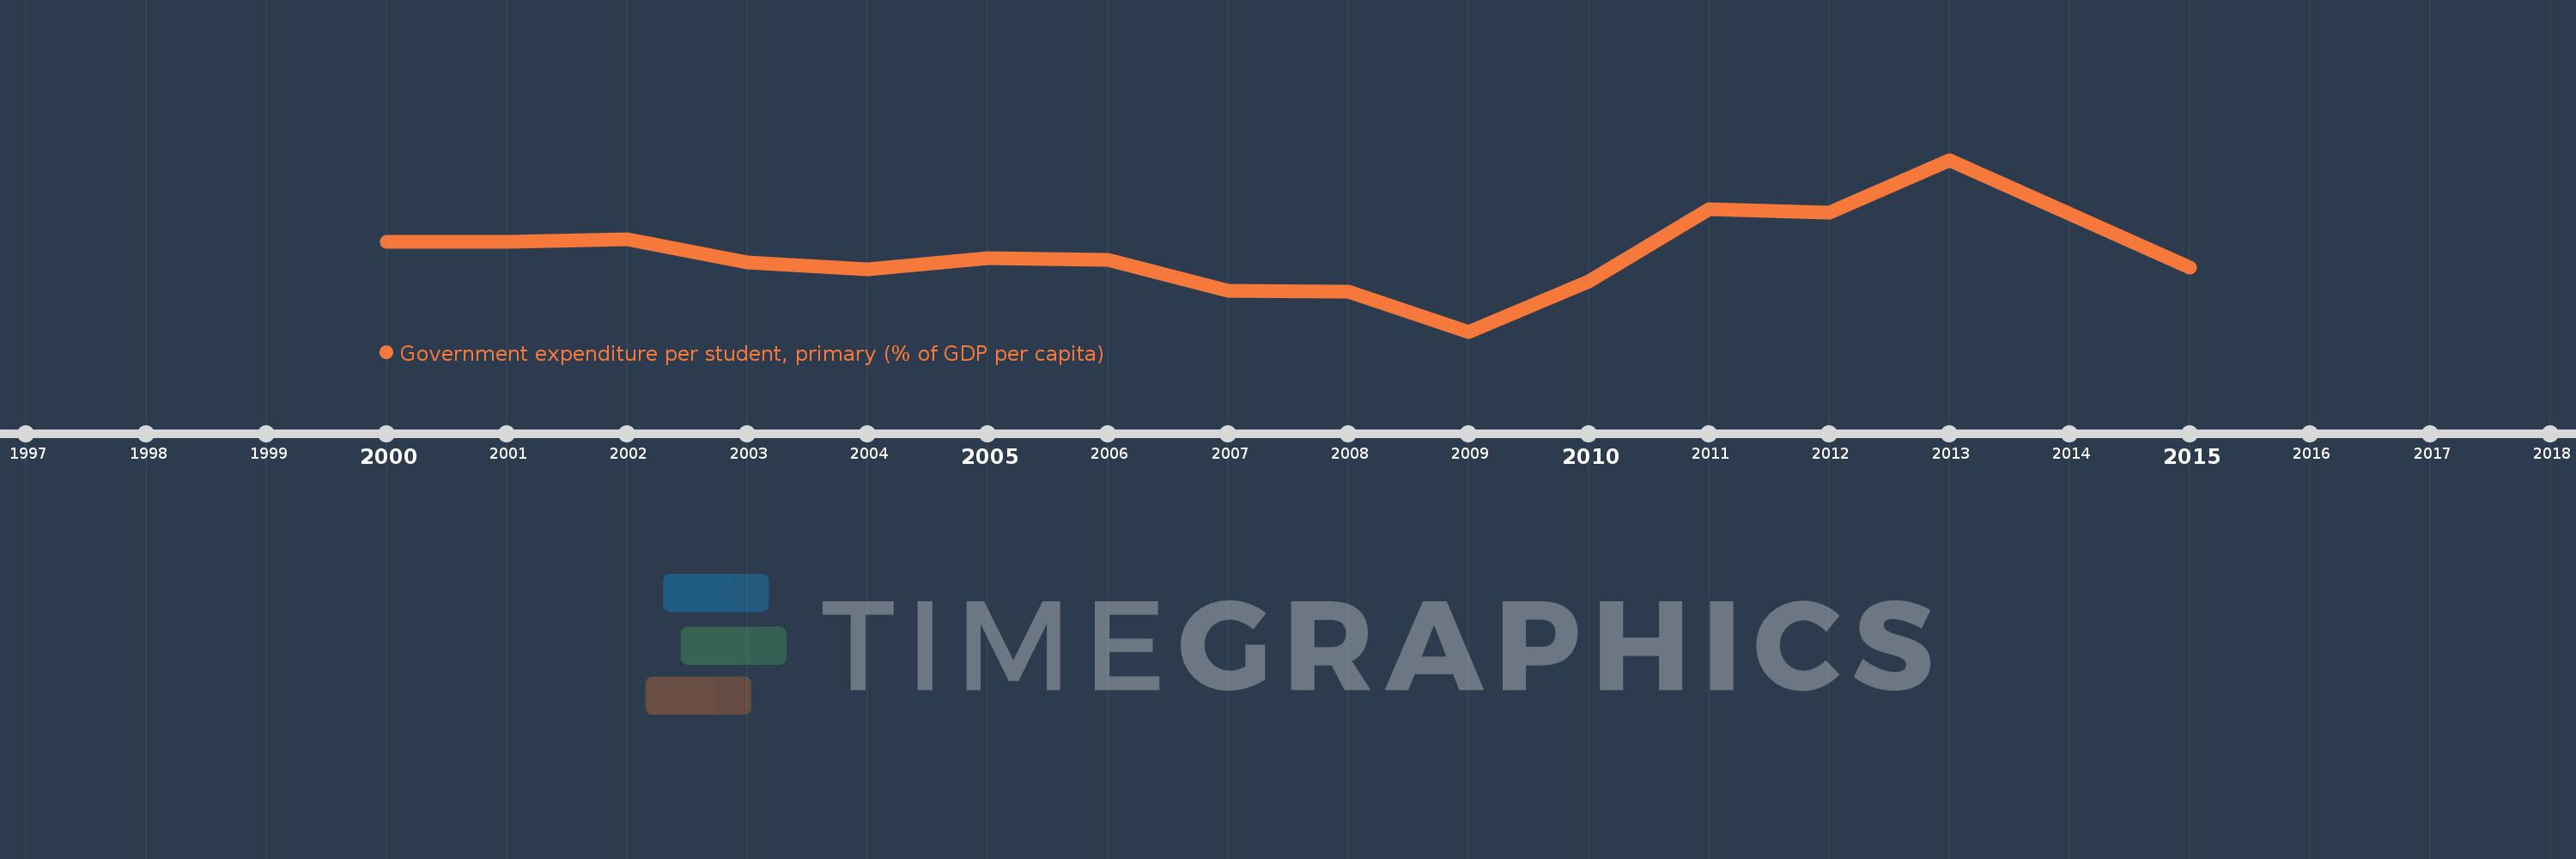
Questa scala temporale mostra un grafico dal 2000 anno al 2015 anno. New Zealand. I dati fino ad 1999 anno non disponibili. Il numero di osservazioni attuali secondo i date: 15.
La fonte (nome):
Indicatori dello sviluppo mondiale
La fonte (organizzazione):
United Nations Educational, Scientific, and Cultural Organization (UNESCO) Institute for Statistics.
Categorie:
Education
sono stati aggiornati
23 apr 2017 anni
Indicatori delle variazioni dei valori per anni
In media:
18.96
Minima:
15.004
1 gen 2009 anni
Massimo:
23.827
1 gen 2013 anni
Alla data di osservazione
Valore
Variazione assoluta
La variazione rispetto al valore precedente
1 gen 2000 anni
19.592
+19.592
0.0%
1 gen 2001 anni
19.61
+0.018
0.09%
1 gen 2002 anni
19.751
+0.142
0.72%
1 gen 2003 anni
18.565
-1.186
-6.0%
1 gen 2004 anni
18.198
-0.367
-1.98%
1 gen 2005 anni
18.755
+0.557
3.06%
1 gen 2006 anni
18.694
-0.061
-0.33%
1 gen 2007 anni
17.085
-1.608
-8.6%
1 gen 2008 anni
17.036
-0.049
-0.29%
1 gen 2009 anni
15.004
-2.032
-11.93%
1 gen 2010 anni
17.606
+2.601
17.34%
1 gen 2011 anni
21.273
+3.667
20.83%
1 gen 2012 anni
21.134
-0.139
-0.66%
1 gen 2013 anni
23.827
+2.694
12.75%
1 gen 2015 anni
18.273
-5.554
-23.31%
Classificazione dei paesi secondo i statistiche attuali per anni