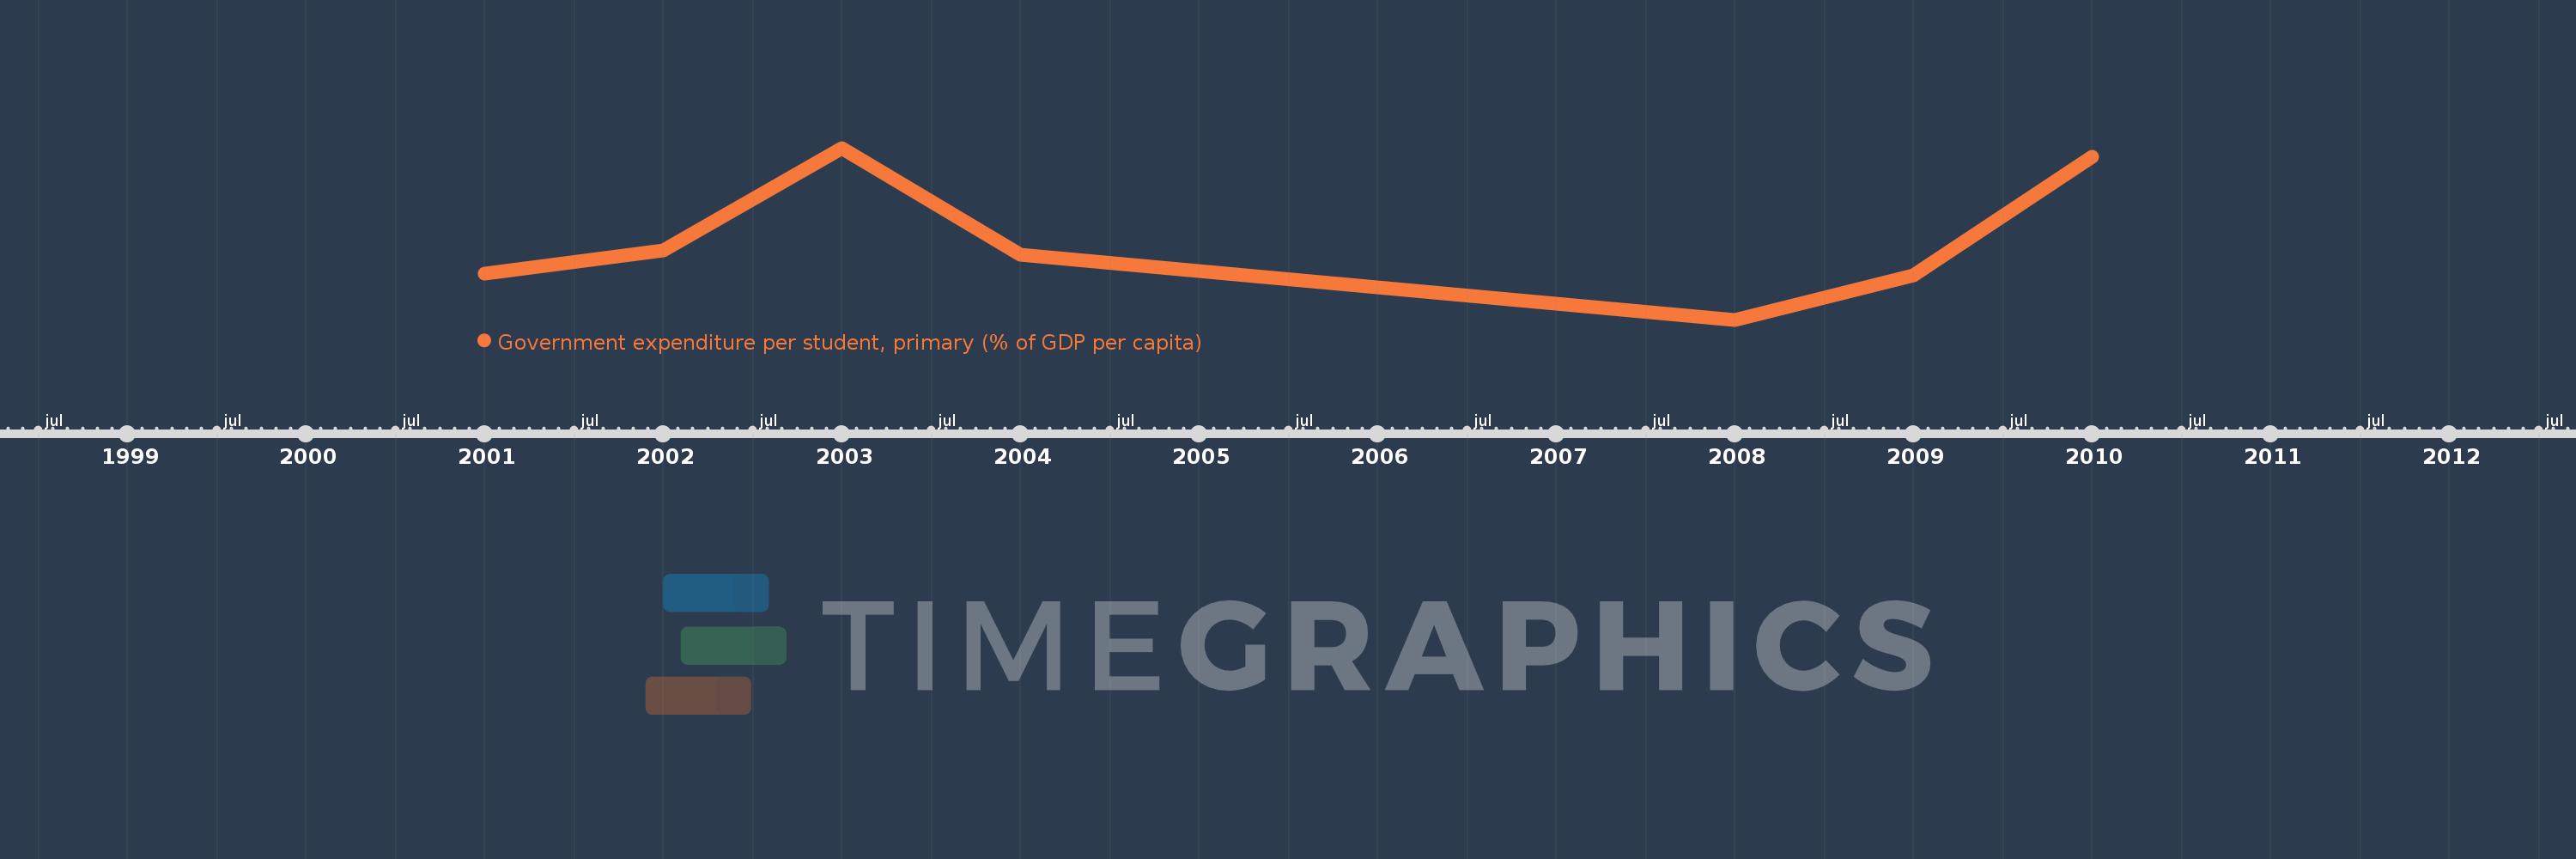
Questa scala temporale mostra un grafico dal 2001 anno al 2010 anno. Trinidad and Tobago. I dati fino ad 2000 anno non disponibili. Il numero di osservazioni attuali secondo i date: 7.
La fonte (nome):
Indicatori dello sviluppo mondiale
La fonte (organizzazione):
United Nations Educational, Scientific, and Cultural Organization (UNESCO) Institute for Statistics.
Categorie:
Education
sono stati aggiornati
23 apr 2017 anni
Indicatori delle variazioni dei valori per anni
In media:
11.783
Minima:
8.58
1 gen 2008 anni
Massimo:
15.454
1 gen 2003 anni
Alla data di osservazione
Valore
Variazione assoluta
La variazione rispetto al valore precedente
1 gen 2001 anni
10.417
+10.417
0.0%
1 gen 2002 anni
11.362
+0.946
9.08%
1 gen 2003 anni
15.454
+4.091
36.01%
1 gen 2004 anni
11.189
-4.264
-27.59%
1 gen 2008 anni
8.58
-2.61
-23.32%
1 gen 2009 anni
10.37
+1.79
20.86%
1 gen 2010 anni
15.107
+4.738
45.69%
Classificazione dei paesi secondo i statistiche attuali per anni