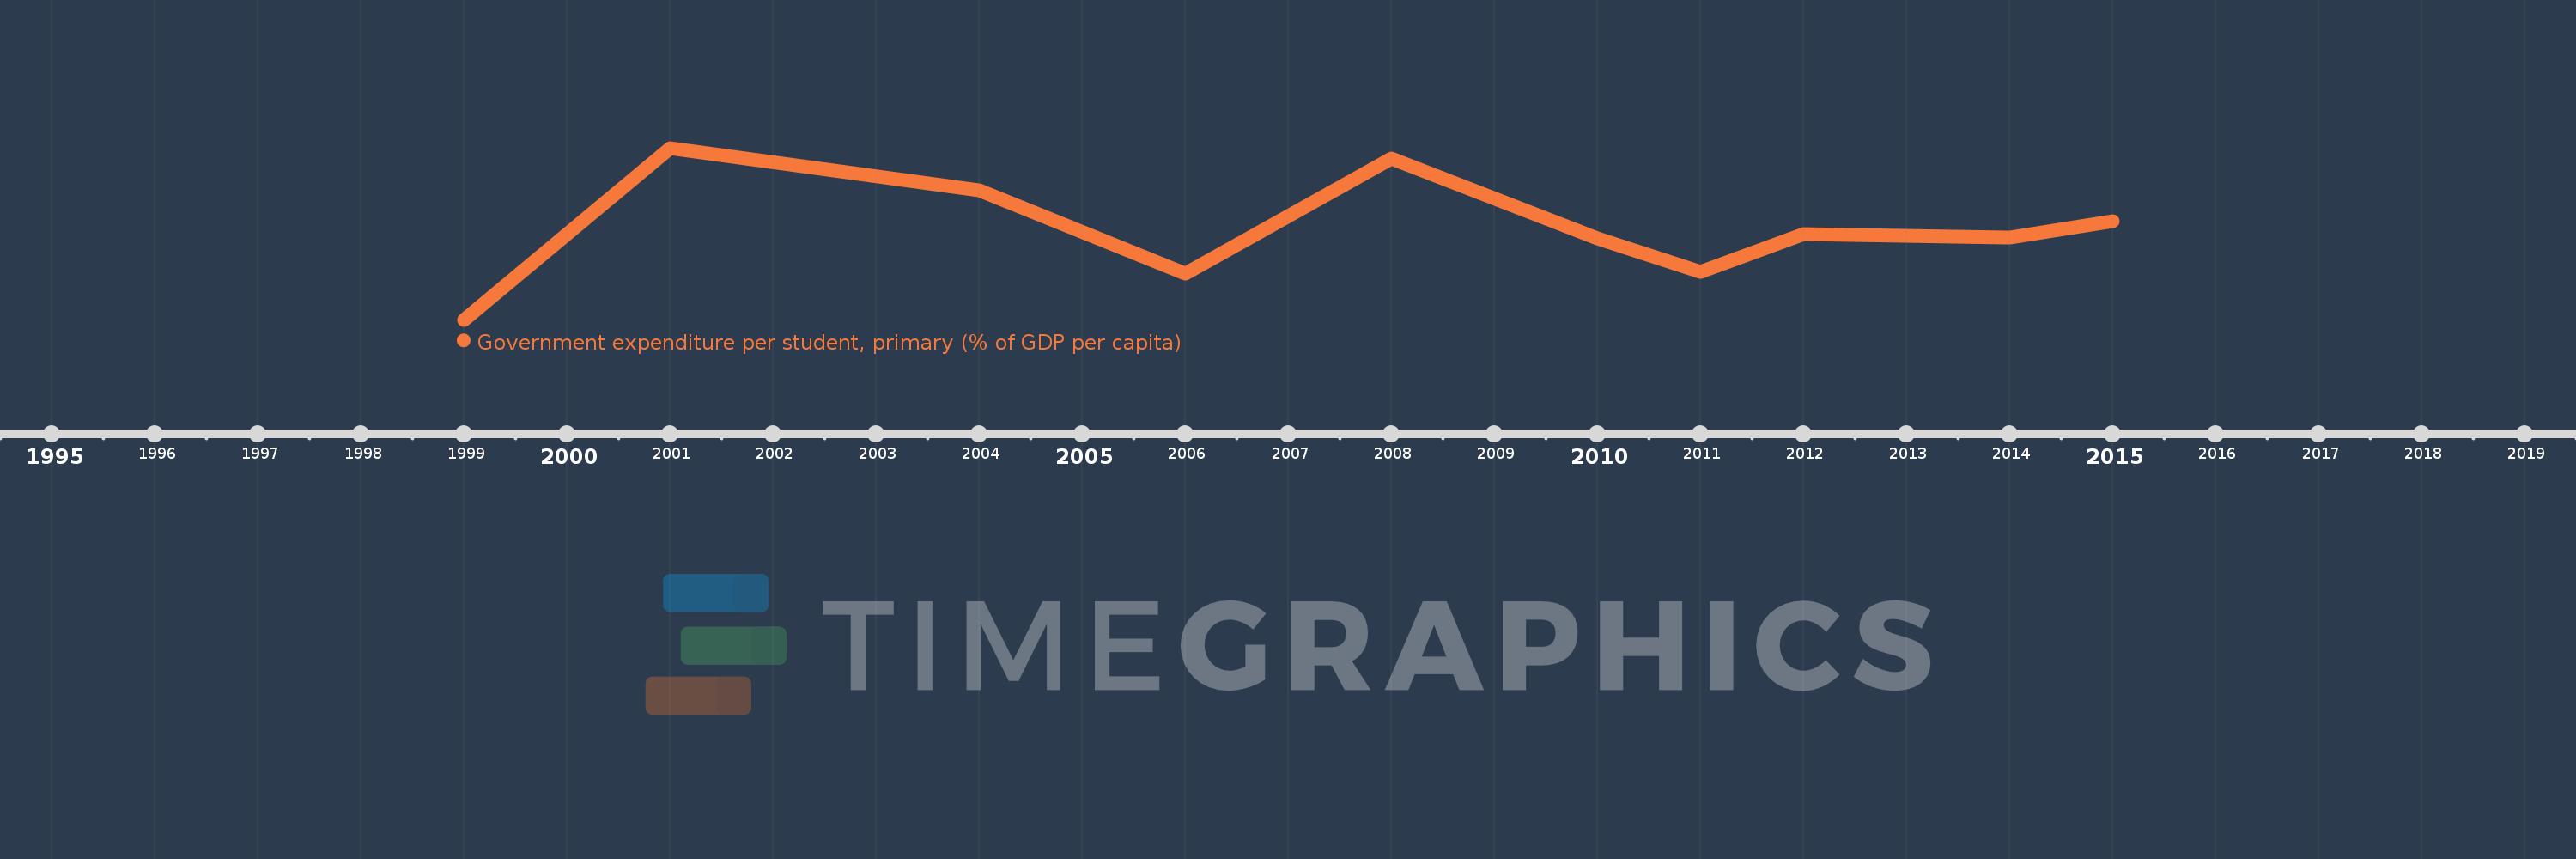
Questa scala temporale mostra un grafico dal 1999 anno al 2015 anno. St. Vincent and the Grenadines. I dati fino ad 1998 anno non disponibili. Il numero di osservazioni attuali secondo i date: 10.
La fonte (nome):
Indicatori dello sviluppo mondiale
La fonte (organizzazione):
United Nations Educational, Scientific, and Cultural Organization (UNESCO) Institute for Statistics.
Categorie:
Education
sono stati aggiornati
23 apr 2017 anni
Indicatori delle variazioni dei valori per anni
In media:
17.902
Minima:
13.732
1 gen 1999 anni
Massimo:
21.652
1 gen 2001 anni
Alla data di osservazione
Valore
Variazione assoluta
La variazione rispetto al valore precedente
1 gen 1999 anni
13.732
+13.732
0.0%
1 gen 2001 anni
21.652
+7.92
57.68%
1 gen 2004 anni
19.71
-1.942
-8.97%
1 gen 2006 anni
15.843
-3.866
-19.62%
1 gen 2008 anni
21.184
+5.341
33.71%
1 gen 2010 anni
17.47
-3.714
-17.53%
1 gen 2011 anni
15.937
-1.534
-8.78%
1 gen 2012 anni
17.69
+1.753
11.0%
1 gen 2014 anni
17.515
-0.175
-0.99%
1 gen 2015 anni
18.288
+0.773
4.41%
Classificazione dei paesi secondo i statistiche attuali per anni