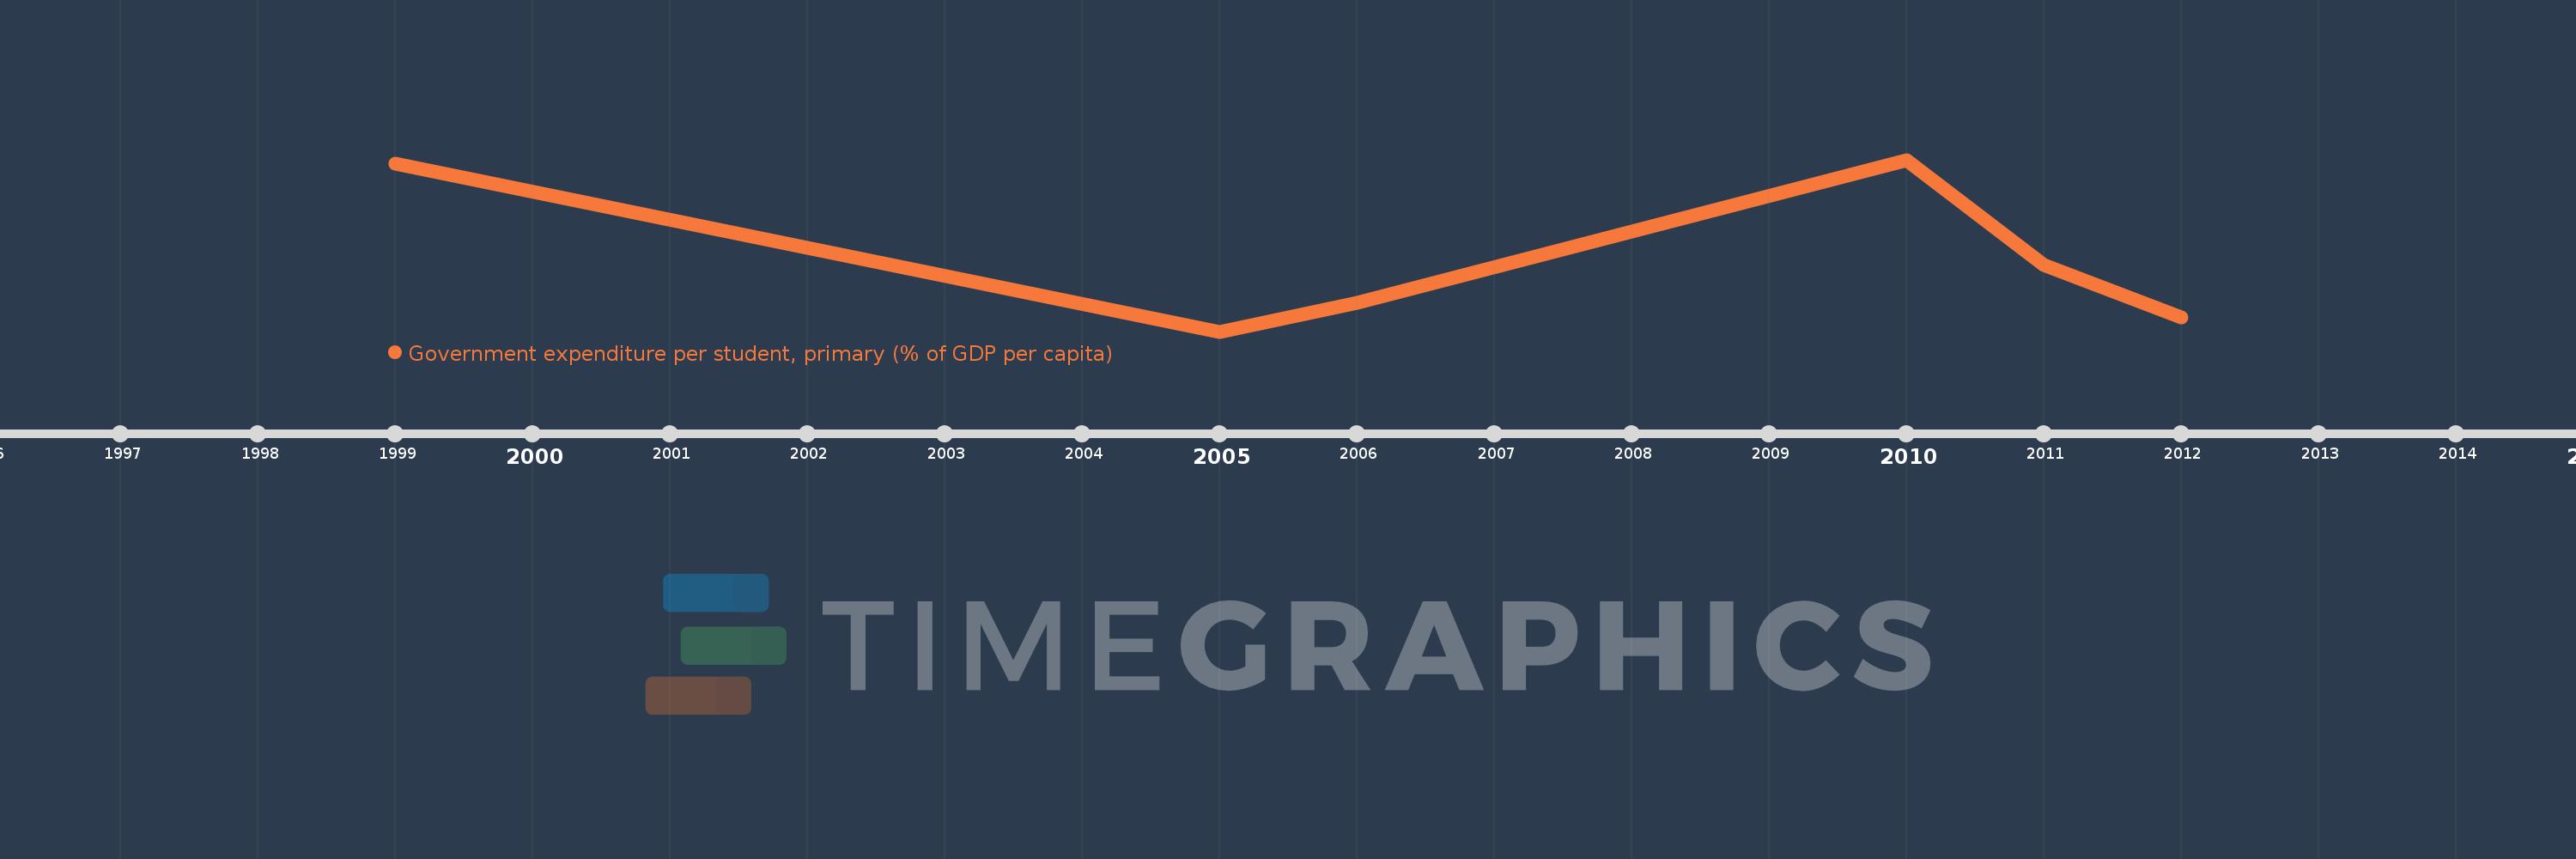
Questa scala temporale mostra un grafico dal 1999 anno al 2012 anno. Chad. I dati fino ad 1998 anno non disponibili. Il numero di osservazioni attuali secondo i date: 6.
La fonte (nome):
Indicatori dello sviluppo mondiale
La fonte (organizzazione):
United Nations Educational, Scientific, and Cultural Organization (UNESCO) Institute for Statistics.
Categorie:
Education
sono stati aggiornati
23 apr 2017 anni
Indicatori delle variazioni dei valori per anni
In media:
7.236
Minima:
5.54
1 gen 2005 anni
Massimo:
9.433
1 gen 2010 anni
Alla data di osservazione
Valore
Variazione assoluta
La variazione rispetto al valore precedente
1 gen 1999 anni
9.355
+9.355
0.0%
1 gen 2005 anni
5.54
-3.815
-40.78%
1 gen 2006 anni
6.188
+0.648
11.7%
1 gen 2010 anni
9.433
+3.244
52.42%
1 gen 2011 anni
7.047
-2.385
-25.29%
1 gen 2012 anni
5.855
-1.192
-16.91%
Classificazione dei paesi secondo i statistiche attuali per anni