33
/fr/
AIzaSyAYiBZKx7MnpbEhh9jyipgxe19OcubqV5w
August 1, 2025
99073
Cambodia
KHM
true
2
1
Personal transfers, receipts (BoP, current US$)
2015,2014,2013,2012,2011,2010,2009,2008,2007,2006,2005,2004,2003,2002,2001,2000,1999,1998,1997,1996,1995,1994,1993
Download
Bibliothèque de statistiques globales →Cambodia →

Personal transfers, receipts (BoP, current US$)

Cette statistique dans les autres pays:

AfghanistanAlbaniaAlgeriaAngolaAntigua and BarbudaArgentinaArmeniaArubaAustriaAzerbaijanBangladeshBarbadosBelarusBelgiumBelizeBeninBermudaBhutanBoliviaBosnia and HerzegovinaBotswanaBrazilBulgariaBurkina FasoBurundiCabo VerdeCambodiaCameroonCaribbean small statesCentral Europe and the BalticsChadChinaColombiaComorosCongo, Rep.Costa RicaCote d'IvoireCroatiaCuracaoCyprusCzech RepublicDjiboutiDominicaDominican RepublicEarly-demographic dividendEast Asia & PacificEast Asia & Pacific (excluding high income)East Asia & Pacific (IDA & IBRD countries)EcuadorEgypt, Arab Rep.El SalvadorEstoniaEthiopiaEuro areaEurope & Central AsiaEurope & Central Asia (excluding high income)Europe & Central Asia (IDA & IBRD countries)European UnionFijiFragile and conflict affected situationsFranceFrench PolynesiaGabonGambia, TheGeorgiaGermanyGhanaGreeceGrenadaGuatemalaGuineaGuinea-BissauGuyanaHaitiHeavily indebted poor countries (HIPC)HondurasHungaryIBRD onlyIcelandIDA & IBRD totalIDA blendIDA onlyIDA totalIndiaIndonesiaIraqIrelandItalyJamaicaJapanJordanKazakhstanKenyaKiribatiKorea, Rep.KosovoKyrgyz RepublicLao PDRLate-demographic dividendLatin America & Caribbean Latin America & Caribbean (excluding high income)Latin America & the Caribbean (IDA & IBRD countries)LatviaLeast developed countries: UN classificationLebanonLesothoLiberiaLibyaLithuaniaLow & middle incomeLow incomeLower middle incomeLuxembourgMacao SAR, ChinaMacedonia, FYRMadagascarMalawiMaldivesMaliMaltaMarshall IslandsMauritaniaMexicoMicronesia, Fed. Sts.Middle East & North Africa (excluding high income)Middle East & North Africa (IDA & IBRD countries)Middle incomeMoldovaMongoliaMontenegroMoroccoMozambiqueMyanmarNamibiaNepalNetherlandsNew CaledoniaNew ZealandNicaraguaNigerNigeriaNorwayOECD membersOmanOther small statesPacific island small statesPakistanPalauPanamaPapua New GuineaParaguayPeruPhilippinesPolandPortugalPost-demographic dividendPre-demographic dividendQatarRomaniaRussian FederationRwandaSamoaSao Tome and PrincipeSenegalSerbiaSeychellesSierra LeoneSint Maarten (Dutch part)Slovak RepublicSloveniaSmall statesSolomon IslandsSouth AsiaSouth Asia (IDA & IBRD)SpainSri LankaSt. Kitts and NevisSt. LuciaSt. Vincent and the GrenadinesSub-Saharan Africa Sub-Saharan Africa (excluding high income)Sub-Saharan Africa (IDA & IBRD countries)SudanSurinameSwazilandSwedenSwitzerlandSyrian Arab RepublicTajikistanTanzaniaThailandTimor-LesteTogoTongaTrinidad and TobagoTunisiaTurkeyTuvaluUgandaUkraineUnited KingdomUpper middle incomeUruguayVanuatuVenezuela, RBWest Bank and GazaWorldYemen, Rep.ZambiaZimbabwe

La ligne de temps

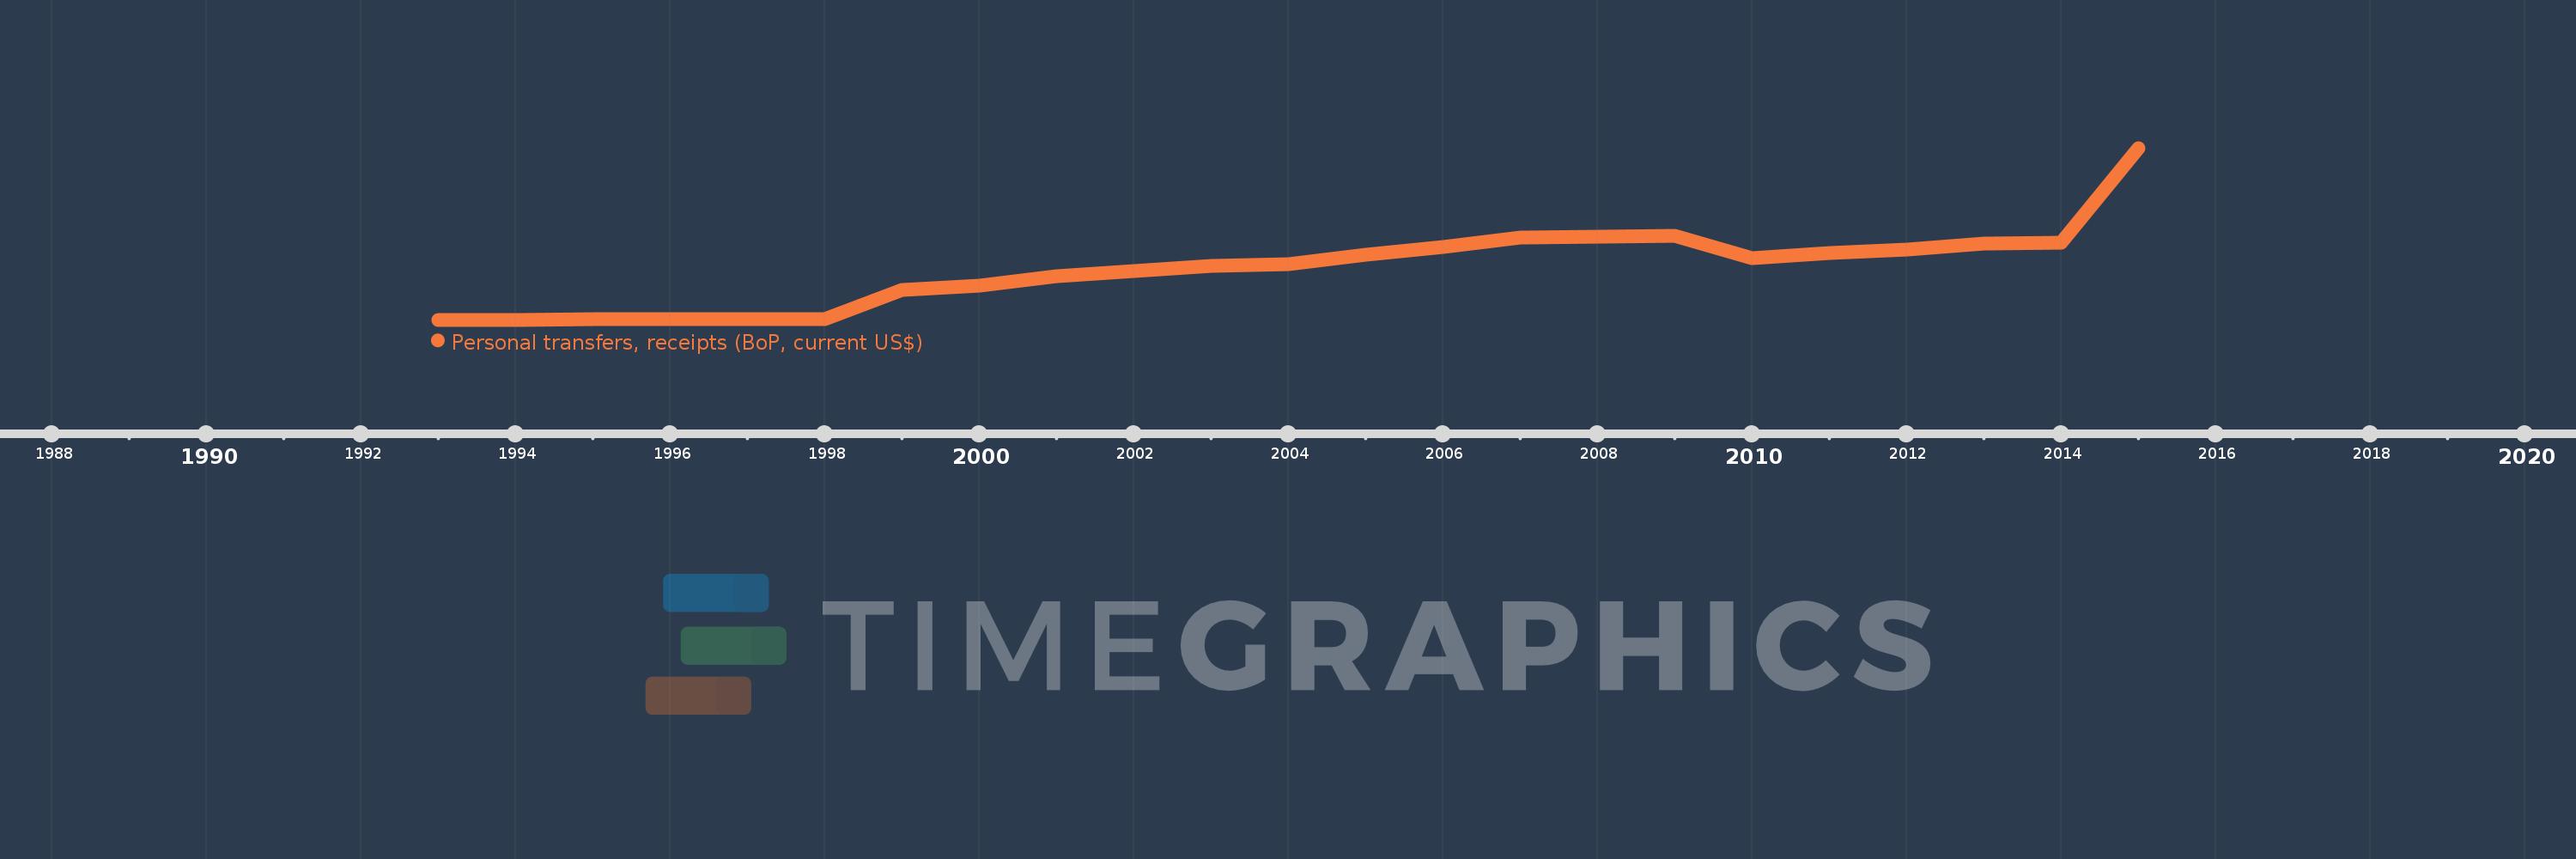
Cette échelle de temps montre un graphique de 1993 année à 2015 année Cambodia. Les données jusqu'à 1992 année ne sont pas présentés. Quantité d'observations actuelles selon dates: 23.

Source (désignation):

Les indicateurs du développement mondiale

Source (organisation):

International Monetary Fund, Balance of Payments Statistics Yearbook and data files.

Catégories:

Economy & Growth, Financial Sector

Dernière mise à jour

23 avr. 2017

Les indicateurs de changement de valeurs selon les années

En moyenne:
115.427 mln.
Minimum:
9.0 mln.
1 janv. 1993
Maximum:
365.551 mln.
1 janv. 2015
Pour la date d''observation
Valeur
Changement absolu
Le changement par rapport à la valeur précédente
1 janv. 1993
9.0 mln.
+9.0 mln.
0.0%
1 janv. 1994
9.0 mln.
0.0
0.0%
1 janv. 1995
10.0 mln.
+1000.0 milles
11.11%
1 janv. 1996
10.0 mln.
0.0
0.0%
1 janv. 1997
10.0 mln.
0.0
0.0%
1 janv. 1998
10.0 mln.
0.0
0.0%
1 janv. 1999
70.0 mln.
+60.0 mln.
600.0%
1 janv. 2000
80.0 mln.
+10.0 mln.
14.29%
1 janv. 2001
100.0 mln.
+20.0 mln.
25.0%
1 janv. 2002
110.0 mln.
+10.0 mln.
10.0%
1 janv. 2003
120.0 mln.
+10.0 mln.
9.09%
1 janv. 2004
125.0 mln.
+5.0 mln.
4.17%
1 janv. 2005
144.0 mln.
+19.0 mln.
15.2%
1 janv. 2006
160.0 mln.
+16.0 mln.
11.11%
1 janv. 2007
180.0 mln.
+20.0 mln.
12.5%
1 janv. 2008
181.8 mln.
+1.8 mln.
1.0%
1 janv. 2009
183.618 mln.
+1.818 mln.
1.0%
1 janv. 2010
137.714 mln.
-45.904 mln.
-25.0%
1 janv. 2011
148.042 mln.
+10.329 mln.
7.5%
1 janv. 2012
155.444 mln.
+7.402 mln.
5.0%
1 janv. 2013
166.906 mln.
+11.462 mln.
7.37%
1 janv. 2014
168.75 mln.
+1.844 mln.
1.1%
1 janv. 2015
365.551 mln.
+196.801 mln.
116.62%

Classement des pays selon les statistiques actuelles par années