33
/fr/
AIzaSyAYiBZKx7MnpbEhh9jyipgxe19OcubqV5w
August 1, 2025
81020
Belarus
BLR
true
2
1
Personal transfers, receipts (BoP, current US$)
2016,2015,2014,2013,2012,2011,2010,2009,2008,2007,2006,2005,2004,2003,2002,2001,2000,1999,1998,1997,1996,1995,1994
Download
Bibliothèque de statistiques globales →Belarus →

Personal transfers, receipts (BoP, current US$)

Cette statistique dans les autres pays:

AfghanistanAlbaniaAlgeriaAngolaAntigua and BarbudaArgentinaArmeniaArubaAustriaAzerbaijanBangladeshBarbadosBelarusBelgiumBelizeBeninBermudaBhutanBoliviaBosnia and HerzegovinaBotswanaBrazilBulgariaBurkina FasoBurundiCabo VerdeCambodiaCameroonCaribbean small statesCentral Europe and the BalticsChadChinaColombiaComorosCongo, Rep.Costa RicaCote d'IvoireCroatiaCuracaoCyprusCzech RepublicDjiboutiDominicaDominican RepublicEarly-demographic dividendEast Asia & PacificEast Asia & Pacific (excluding high income)East Asia & Pacific (IDA & IBRD countries)EcuadorEgypt, Arab Rep.El SalvadorEstoniaEthiopiaEuro areaEurope & Central AsiaEurope & Central Asia (excluding high income)Europe & Central Asia (IDA & IBRD countries)European UnionFijiFragile and conflict affected situationsFranceFrench PolynesiaGabonGambia, TheGeorgiaGermanyGhanaGreeceGrenadaGuatemalaGuineaGuinea-BissauGuyanaHaitiHeavily indebted poor countries (HIPC)HondurasHungaryIBRD onlyIcelandIDA & IBRD totalIDA blendIDA onlyIDA totalIndiaIndonesiaIraqIrelandItalyJamaicaJapanJordanKazakhstanKenyaKiribatiKorea, Rep.KosovoKyrgyz RepublicLao PDRLate-demographic dividendLatin America & Caribbean Latin America & Caribbean (excluding high income)Latin America & the Caribbean (IDA & IBRD countries)LatviaLeast developed countries: UN classificationLebanonLesothoLiberiaLibyaLithuaniaLow & middle incomeLow incomeLower middle incomeLuxembourgMacao SAR, ChinaMacedonia, FYRMadagascarMalawiMaldivesMaliMaltaMarshall IslandsMauritaniaMexicoMicronesia, Fed. Sts.Middle East & North Africa (excluding high income)Middle East & North Africa (IDA & IBRD countries)Middle incomeMoldovaMongoliaMontenegroMoroccoMozambiqueMyanmarNamibiaNepalNetherlandsNew CaledoniaNew ZealandNicaraguaNigerNigeriaNorwayOECD membersOmanOther small statesPacific island small statesPakistanPalauPanamaPapua New GuineaParaguayPeruPhilippinesPolandPortugalPost-demographic dividendPre-demographic dividendQatarRomaniaRussian FederationRwandaSamoaSao Tome and PrincipeSenegalSerbiaSeychellesSierra LeoneSint Maarten (Dutch part)Slovak RepublicSloveniaSmall statesSolomon IslandsSouth AsiaSouth Asia (IDA & IBRD)SpainSri LankaSt. Kitts and NevisSt. LuciaSt. Vincent and the GrenadinesSub-Saharan Africa Sub-Saharan Africa (excluding high income)Sub-Saharan Africa (IDA & IBRD countries)SudanSurinameSwazilandSwedenSwitzerlandSyrian Arab RepublicTajikistanTanzaniaThailandTimor-LesteTogoTongaTrinidad and TobagoTunisiaTurkeyTuvaluUgandaUkraineUnited KingdomUpper middle incomeUruguayVanuatuVenezuela, RBWest Bank and GazaWorldYemen, Rep.ZambiaZimbabwe

La ligne de temps

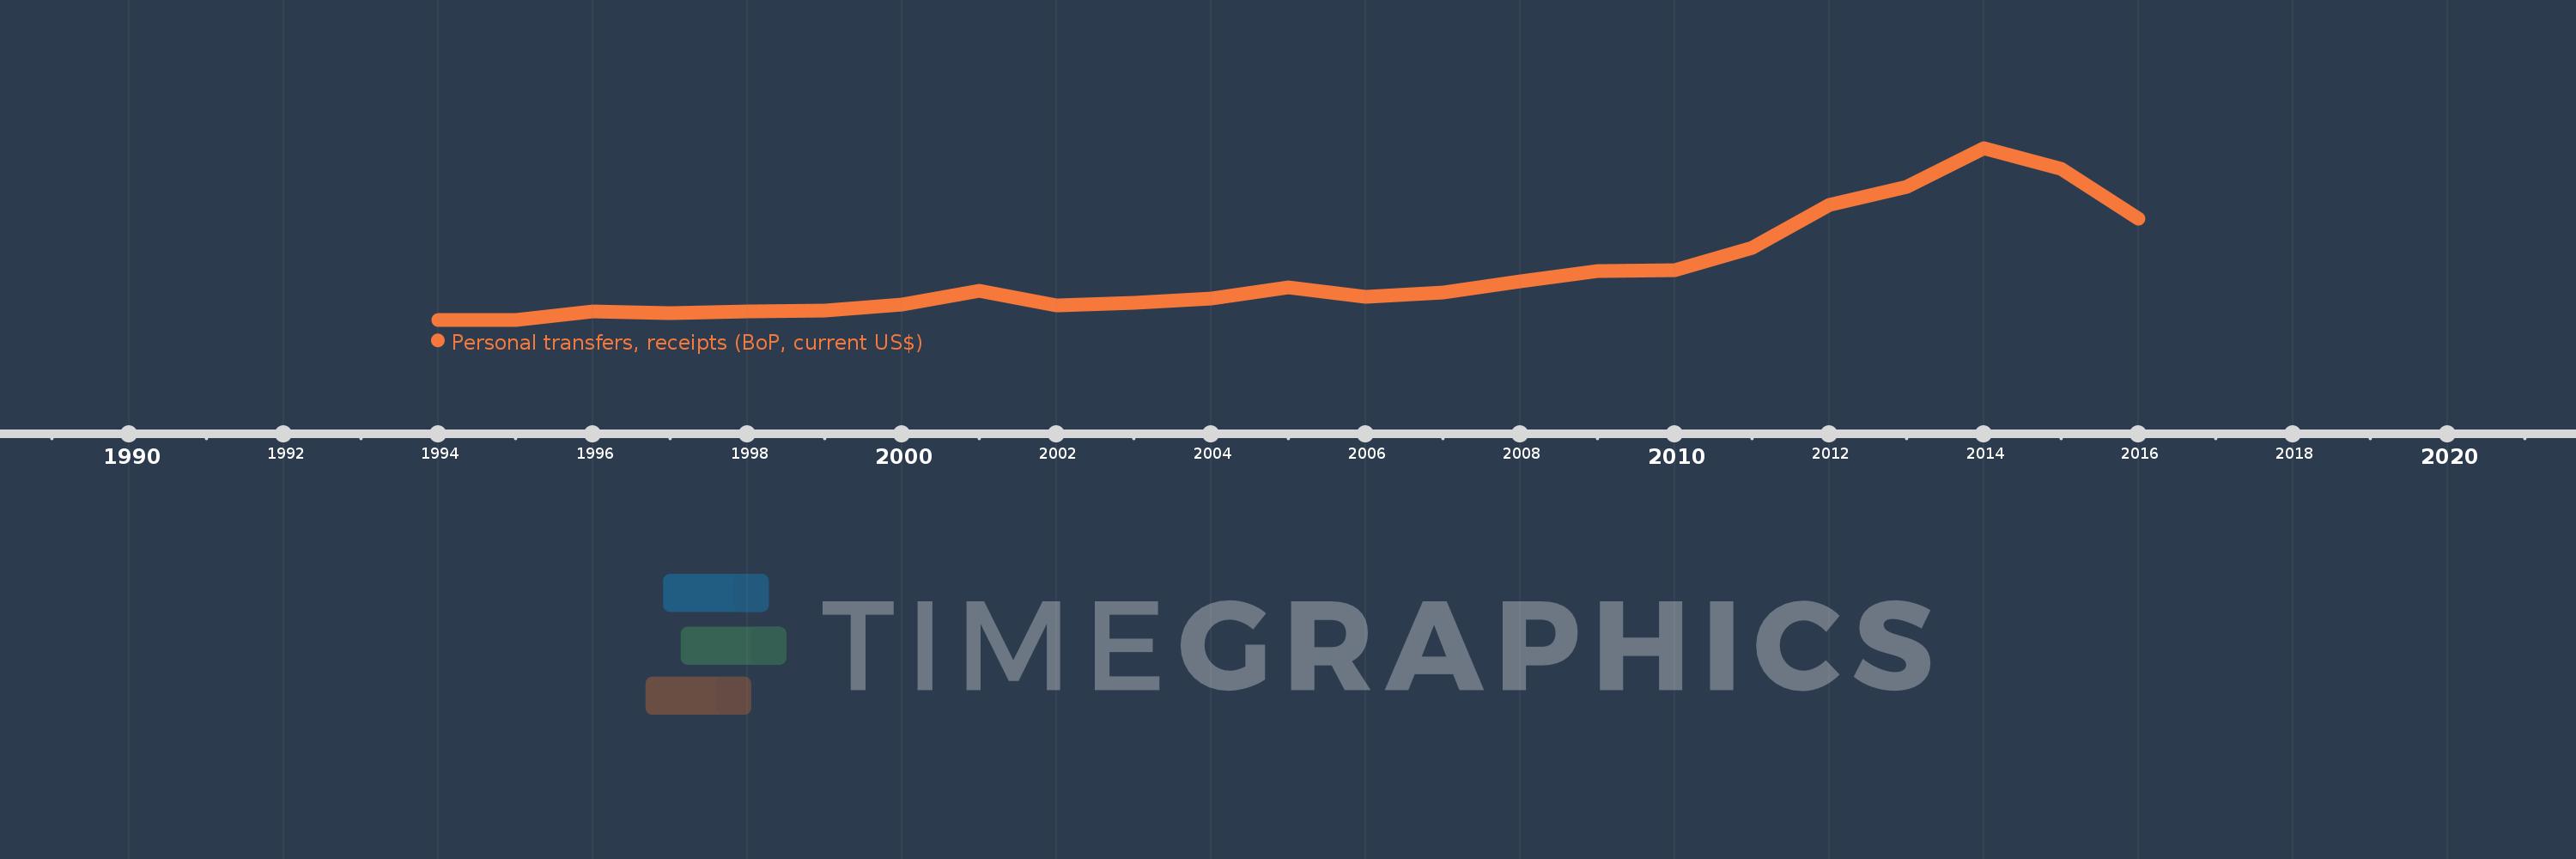
Cette échelle de temps montre un graphique de 1994 année à 2016 année Belarus. Les données jusqu'à 1993 année ne sont pas présentés. Quantité d'observations actuelles selon dates: 23.

Source (désignation):

Les indicateurs du développement mondiale

Source (organisation):

International Monetary Fund, Balance of Payments Statistics Yearbook and data files.

Catégories:

Economy & Growth, Financial Sector

Dernière mise à jour

23 avr. 2017

Les indicateurs de changement de valeurs selon les années

En moyenne:
164.0 mln.
Minimum:
400.0 milles
1 janv. 1994
Maximum:
592.6 mln.
1 janv. 2014
Pour la date d''observation
Valeur
Changement absolu
Le changement par rapport à la valeur précédente
1 janv. 1994
400.0 milles
+400.0 milles
0.0%
1 janv. 1995
400.0 milles
0.0
0.0%
1 janv. 1996
28.5 mln.
+28.1 mln.
7.03 milles%
1 janv. 1997
22.6 mln.
-5.9 mln.
-20.7%
1 janv. 1998
29.1 mln.
+6.5 mln.
28.76%
1 janv. 1999
31.7 mln.
+2.6 mln.
8.93%
1 janv. 2000
53.6 mln.
+21.9 mln.
69.09%
1 janv. 2001
100.6 mln.
+47.0 mln.
87.69%
1 janv. 2002
50.3 mln.
-50.3 mln.
-50.0%
1 janv. 2003
60.1 mln.
+9.8 mln.
19.48%
1 janv. 2004
74.9 mln.
+14.8 mln.
24.63%
1 janv. 2005
113.1 mln.
+38.2 mln.
51.0%
1 janv. 2006
78.5 mln.
-34.6 mln.
-30.59%
1 janv. 2007
92.8 mln.
+14.3 mln.
18.22%
1 janv. 2008
131.7 mln.
+38.9 mln.
41.92%
1 janv. 2009
169.5 mln.
+37.8 mln.
28.7%
1 janv. 2010
170.1 mln.
+600.0 milles
0.35%
1 janv. 2011
247.6 mln.
+77.5 mln.
45.56%
1 janv. 2012
395.5 mln.
+147.9 mln.
59.73%
1 janv. 2013
458.6 mln.
+63.1 mln.
15.95%
1 janv. 2014
592.6 mln.
+134.0 mln.
29.22%
1 janv. 2015
521.9 mln.
-70.7 mln.
-11.93%
1 janv. 2016
347.9 mln.
-174.0 mln.
-33.34%

Classement des pays selon les statistiques actuelles par années