33
/fr/
AIzaSyAYiBZKx7MnpbEhh9jyipgxe19OcubqV5w
May 1, 2025
148381
Guyana
GUY
true
2
1
Personal transfers, receipts (BoP, current US$)
2016,2015,2014,2013,2012,2011,2010,2009,2008,2007,2006,2005,2004,2003,2002,2001,2000,1999,1998,1997,1984,1983
Download
Bibliothèque de statistiques globales →Guyana →

Personal transfers, receipts (BoP, current US$)

Cette statistique dans les autres pays:

AfghanistanAlbaniaAlgeriaAngolaAntigua and BarbudaArgentinaArmeniaArubaAustriaAzerbaijanBangladeshBarbadosBelarusBelgiumBelizeBeninBermudaBhutanBoliviaBosnia and HerzegovinaBotswanaBrazilBulgariaBurkina FasoBurundiCabo VerdeCambodiaCameroonCaribbean small statesCentral Europe and the BalticsChadChinaColombiaComorosCongo, Rep.Costa RicaCote d'IvoireCroatiaCuracaoCyprusCzech RepublicDjiboutiDominicaDominican RepublicEarly-demographic dividendEast Asia & PacificEast Asia & Pacific (excluding high income)East Asia & Pacific (IDA & IBRD countries)EcuadorEgypt, Arab Rep.El SalvadorEstoniaEthiopiaEuro areaEurope & Central AsiaEurope & Central Asia (excluding high income)Europe & Central Asia (IDA & IBRD countries)European UnionFijiFragile and conflict affected situationsFranceFrench PolynesiaGabonGambia, TheGeorgiaGermanyGhanaGreeceGrenadaGuatemalaGuineaGuinea-BissauGuyanaHaitiHeavily indebted poor countries (HIPC)HondurasHungaryIBRD onlyIcelandIDA & IBRD totalIDA blendIDA onlyIDA totalIndiaIndonesiaIraqIrelandItalyJamaicaJapanJordanKazakhstanKenyaKiribatiKorea, Rep.KosovoKyrgyz RepublicLao PDRLate-demographic dividendLatin America & Caribbean Latin America & Caribbean (excluding high income)Latin America & the Caribbean (IDA & IBRD countries)LatviaLeast developed countries: UN classificationLebanonLesothoLiberiaLibyaLithuaniaLow & middle incomeLow incomeLower middle incomeLuxembourgMacao SAR, ChinaMacedonia, FYRMadagascarMalawiMaldivesMaliMaltaMarshall IslandsMauritaniaMexicoMicronesia, Fed. Sts.Middle East & North Africa (excluding high income)Middle East & North Africa (IDA & IBRD countries)Middle incomeMoldovaMongoliaMontenegroMoroccoMozambiqueMyanmarNamibiaNepalNetherlandsNew CaledoniaNew ZealandNicaraguaNigerNigeriaNorwayOECD membersOmanOther small statesPacific island small statesPakistanPalauPanamaPapua New GuineaParaguayPeruPhilippinesPolandPortugalPost-demographic dividendPre-demographic dividendQatarRomaniaRussian FederationRwandaSamoaSao Tome and PrincipeSenegalSerbiaSeychellesSierra LeoneSint Maarten (Dutch part)Slovak RepublicSloveniaSmall statesSolomon IslandsSouth AsiaSouth Asia (IDA & IBRD)SpainSri LankaSt. Kitts and NevisSt. LuciaSt. Vincent and the GrenadinesSub-Saharan Africa Sub-Saharan Africa (excluding high income)Sub-Saharan Africa (IDA & IBRD countries)SudanSurinameSwazilandSwedenSwitzerlandSyrian Arab RepublicTajikistanTanzaniaThailandTimor-LesteTogoTongaTrinidad and TobagoTunisiaTurkeyTuvaluUgandaUkraineUnited KingdomUpper middle incomeUruguayVanuatuVenezuela, RBWest Bank and GazaWorldYemen, Rep.ZambiaZimbabwe

La ligne de temps

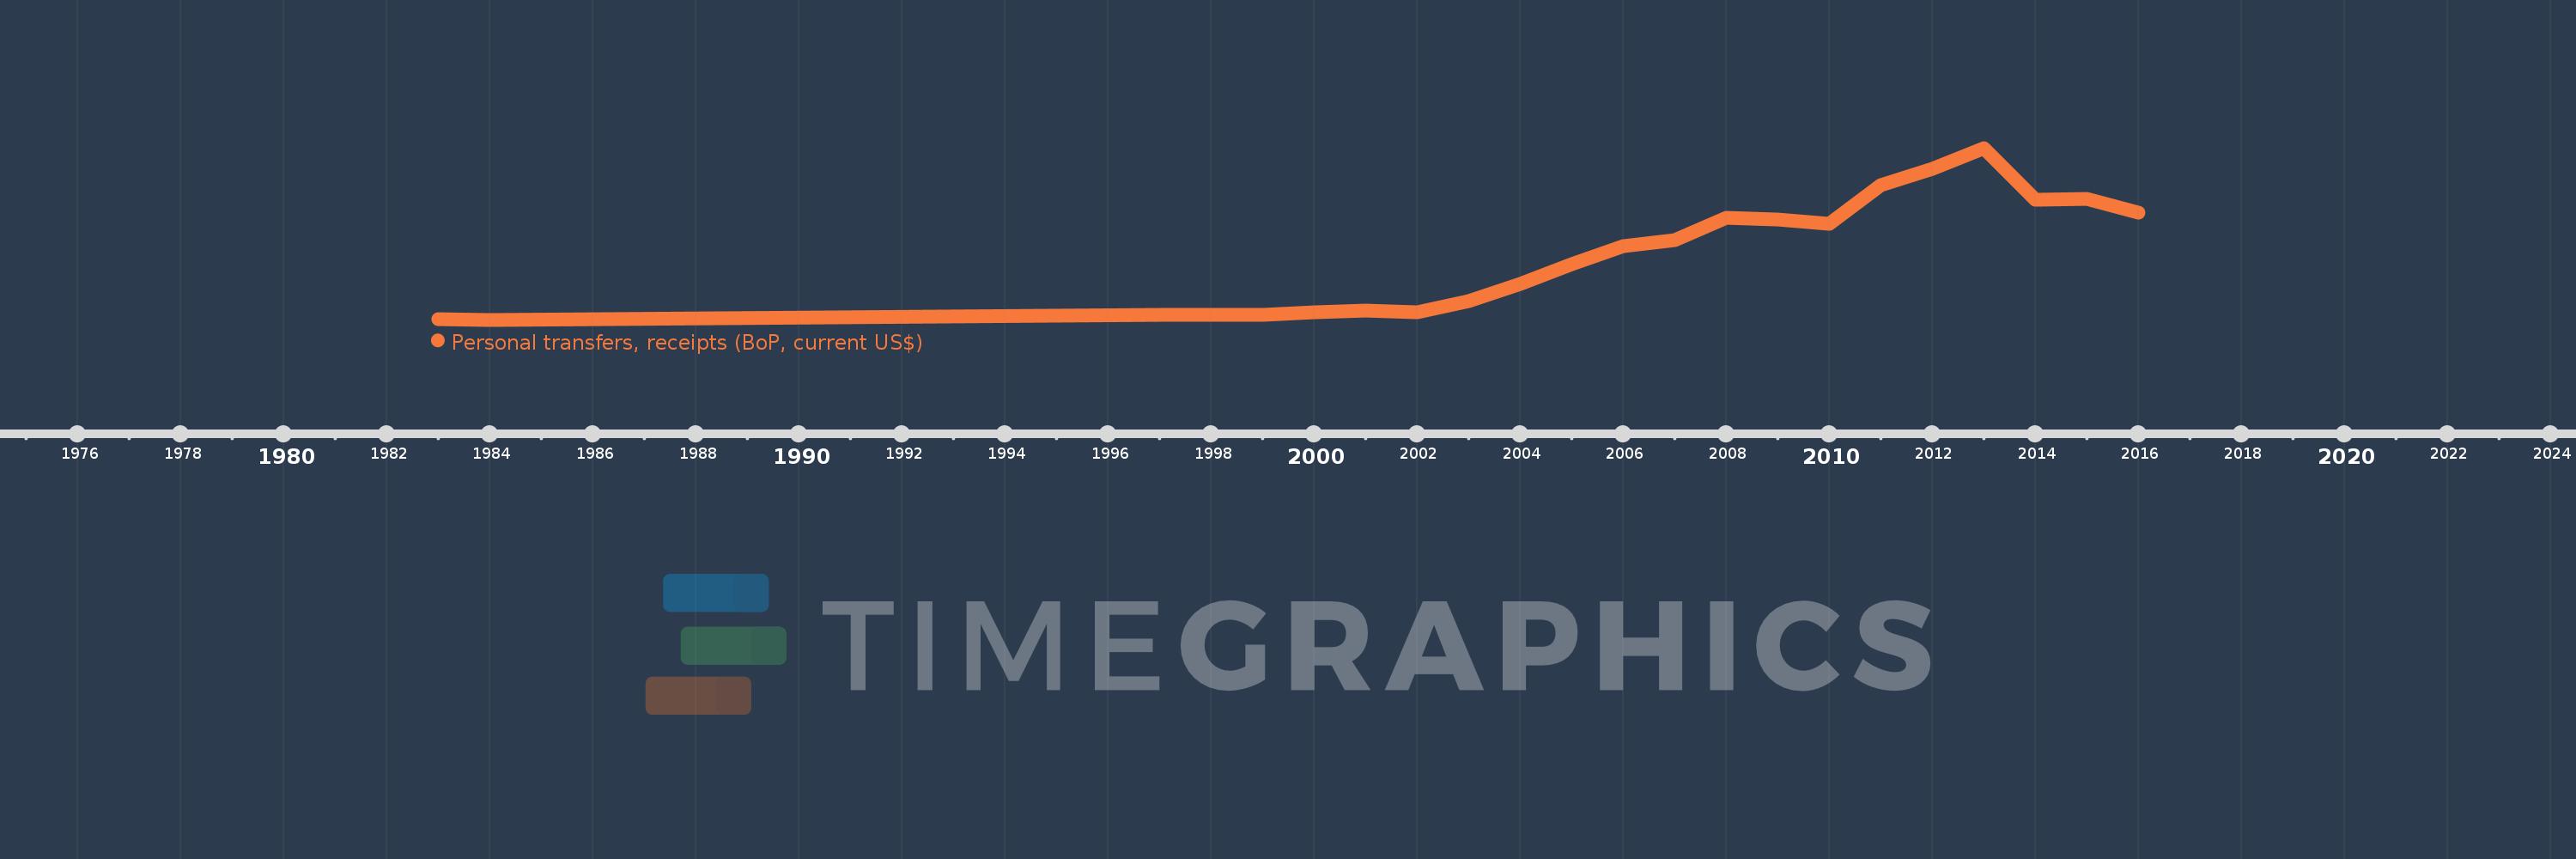
Cette échelle de temps montre un graphique de 1983 année à 2016 année Guyana. Les données jusqu'à 1982 année ne sont pas présentés. Quantité d'observations actuelles selon dates: 22.

Source (désignation):

Les indicateurs du développement mondiale

Source (organisation):

International Monetary Fund, Balance of Payments Statistics Yearbook and data files.

Catégories:

Economy & Growth, Financial Sector

Dernière mise à jour

23 avr. 2017

Les indicateurs de changement de valeurs selon les années

En moyenne:
175.222 mln.
Minimum:
1.167 mln.
1 janv. 1984
Maximum:
469.258 mln.
1 janv. 2013
Pour la date d''observation
Valeur
Changement absolu
Le changement par rapport à la valeur précédente
1 janv. 1983
2.3 mln.
+2.3 mln.
0.0%
1 janv. 1984
1.167 mln.
-1.133 mln.
-49.28%
1 janv. 1997
14.6 mln.
+13.433 mln.
1.15 milles%
1 janv. 1998
15.0 mln.
+400.0 milles
2.74%
1 janv. 1999
14.0 mln.
-1000.0 milles
-6.67%
1 janv. 2000
20.5 mln.
+6.5 mln.
46.43%
1 janv. 2001
27.3 mln.
+6.8 mln.
33.17%
1 janv. 2002
22.3 mln.
-5.0 mln.
-18.32%
1 janv. 2003
51.0 mln.
+28.7 mln.
128.7%
1 janv. 2004
99.3 mln.
+48.3 mln.
94.71%
1 janv. 2005
153.009 mln.
+53.709 mln.
54.09%
1 janv. 2006
201.289 mln.
+48.28 mln.
31.55%
1 janv. 2007
218.076 mln.
+16.787 mln.
8.34%
1 janv. 2008
278.496 mln.
+60.42 mln.
27.71%
1 janv. 2009
273.896 mln.
-4.6 mln.
-1.65%
1 janv. 2010
262.066 mln.
-11.83 mln.
-4.32%
1 janv. 2011
367.805 mln.
+105.74 mln.
40.35%
1 janv. 2012
412.2 mln.
+44.395 mln.
12.07%
1 janv. 2013
469.258 mln.
+57.058 mln.
13.84%
1 janv. 2014
328.153 mln.
-141.106 mln.
-30.07%
1 janv. 2015
329.658 mln.
+1.505 mln.
0.46%
1 janv. 2016
293.505 mln.
-36.153 mln.
-10.97%

Classement des pays selon les statistiques actuelles par années