29
/fr/
fr
AIzaSyAYiBZKx7MnpbEhh9jyipgxe19OcubqV5w
April 1, 2024
106418
China
CHN
true
2
1
Personal transfers, receipts (BoP, current US$)
2016,2005,2004,2003,2002,2001,2000,1999,1998,1997,1996,1995,1994,1993,1992,1991,1990,1989,1988,1987,1986,1985,1984,1983
Download
Bibliothèque de statistiques globales →China →

Personal transfers, receipts (BoP, current US$)

Cette statistique dans les autres pays:
AfghanistanAlbaniaAlgeriaAngolaAntigua and BarbudaArgentinaArmeniaArubaAustriaAzerbaijanBangladeshBarbadosBelarusBelgiumBelizeBeninBermudaBhutanBoliviaBosnia and HerzegovinaBotswanaBrazilBulgariaBurkina FasoBurundiCabo VerdeCambodiaCameroonCaribbean small statesCentral Europe and the BalticsChadChinaColombiaComorosCongo, Rep.Costa RicaCote d'IvoireCroatiaCuracaoCyprusCzech RepublicDjiboutiDominicaDominican RepublicEarly-demographic dividendEast Asia & PacificEast Asia & Pacific (excluding high income)East Asia & Pacific (IDA & IBRD countries)EcuadorEgypt, Arab Rep.El SalvadorEstoniaEthiopiaEuro areaEurope & Central AsiaEurope & Central Asia (excluding high income)Europe & Central Asia (IDA & IBRD countries)European UnionFijiFragile and conflict affected situationsFranceFrench PolynesiaGabonGambia, TheGeorgiaGermanyGhanaGreeceGrenadaGuatemalaGuineaGuinea-BissauGuyanaHaitiHeavily indebted poor countries (HIPC)HondurasHungaryIBRD onlyIcelandIDA & IBRD totalIDA blendIDA onlyIDA totalIndiaIndonesiaIraqIrelandItalyJamaicaJapanJordanKazakhstanKenyaKiribatiKorea, Rep.KosovoKyrgyz RepublicLao PDRLate-demographic dividendLatin America & Caribbean Latin America & Caribbean (excluding high income)Latin America & the Caribbean (IDA & IBRD countries)LatviaLeast developed countries: UN classificationLebanonLesothoLiberiaLibyaLithuaniaLow & middle incomeLow incomeLower middle incomeLuxembourgMacao SAR, ChinaMacedonia, FYRMadagascarMalawiMaldivesMaliMaltaMarshall IslandsMauritaniaMexicoMicronesia, Fed. Sts.Middle East & North Africa (excluding high income)Middle East & North Africa (IDA & IBRD countries)Middle incomeMoldovaMongoliaMontenegroMoroccoMozambiqueMyanmarNamibiaNepalNetherlandsNew CaledoniaNew ZealandNicaraguaNigerNigeriaNorwayOECD membersOmanOther small statesPacific island small statesPakistanPalauPanamaPapua New GuineaParaguayPeruPhilippinesPolandPortugalPost-demographic dividendPre-demographic dividendQatarRomaniaRussian FederationRwandaSamoaSao Tome and PrincipeSenegalSerbiaSeychellesSierra LeoneSint Maarten (Dutch part)Slovak RepublicSloveniaSmall statesSolomon IslandsSouth AsiaSouth Asia (IDA & IBRD)SpainSri LankaSt. Kitts and NevisSt. LuciaSt. Vincent and the GrenadinesSub-Saharan Africa Sub-Saharan Africa (excluding high income)Sub-Saharan Africa (IDA & IBRD countries)SudanSurinameSwazilandSwedenSwitzerlandSyrian Arab RepublicTajikistanTanzaniaThailandTimor-LesteTogoTongaTrinidad and TobagoTunisiaTurkeyTuvaluUgandaUkraineUnited KingdomUpper middle incomeUruguayVanuatuVenezuela, RBWest Bank and GazaWorldYemen, Rep.ZambiaZimbabwe
La ligne de temps
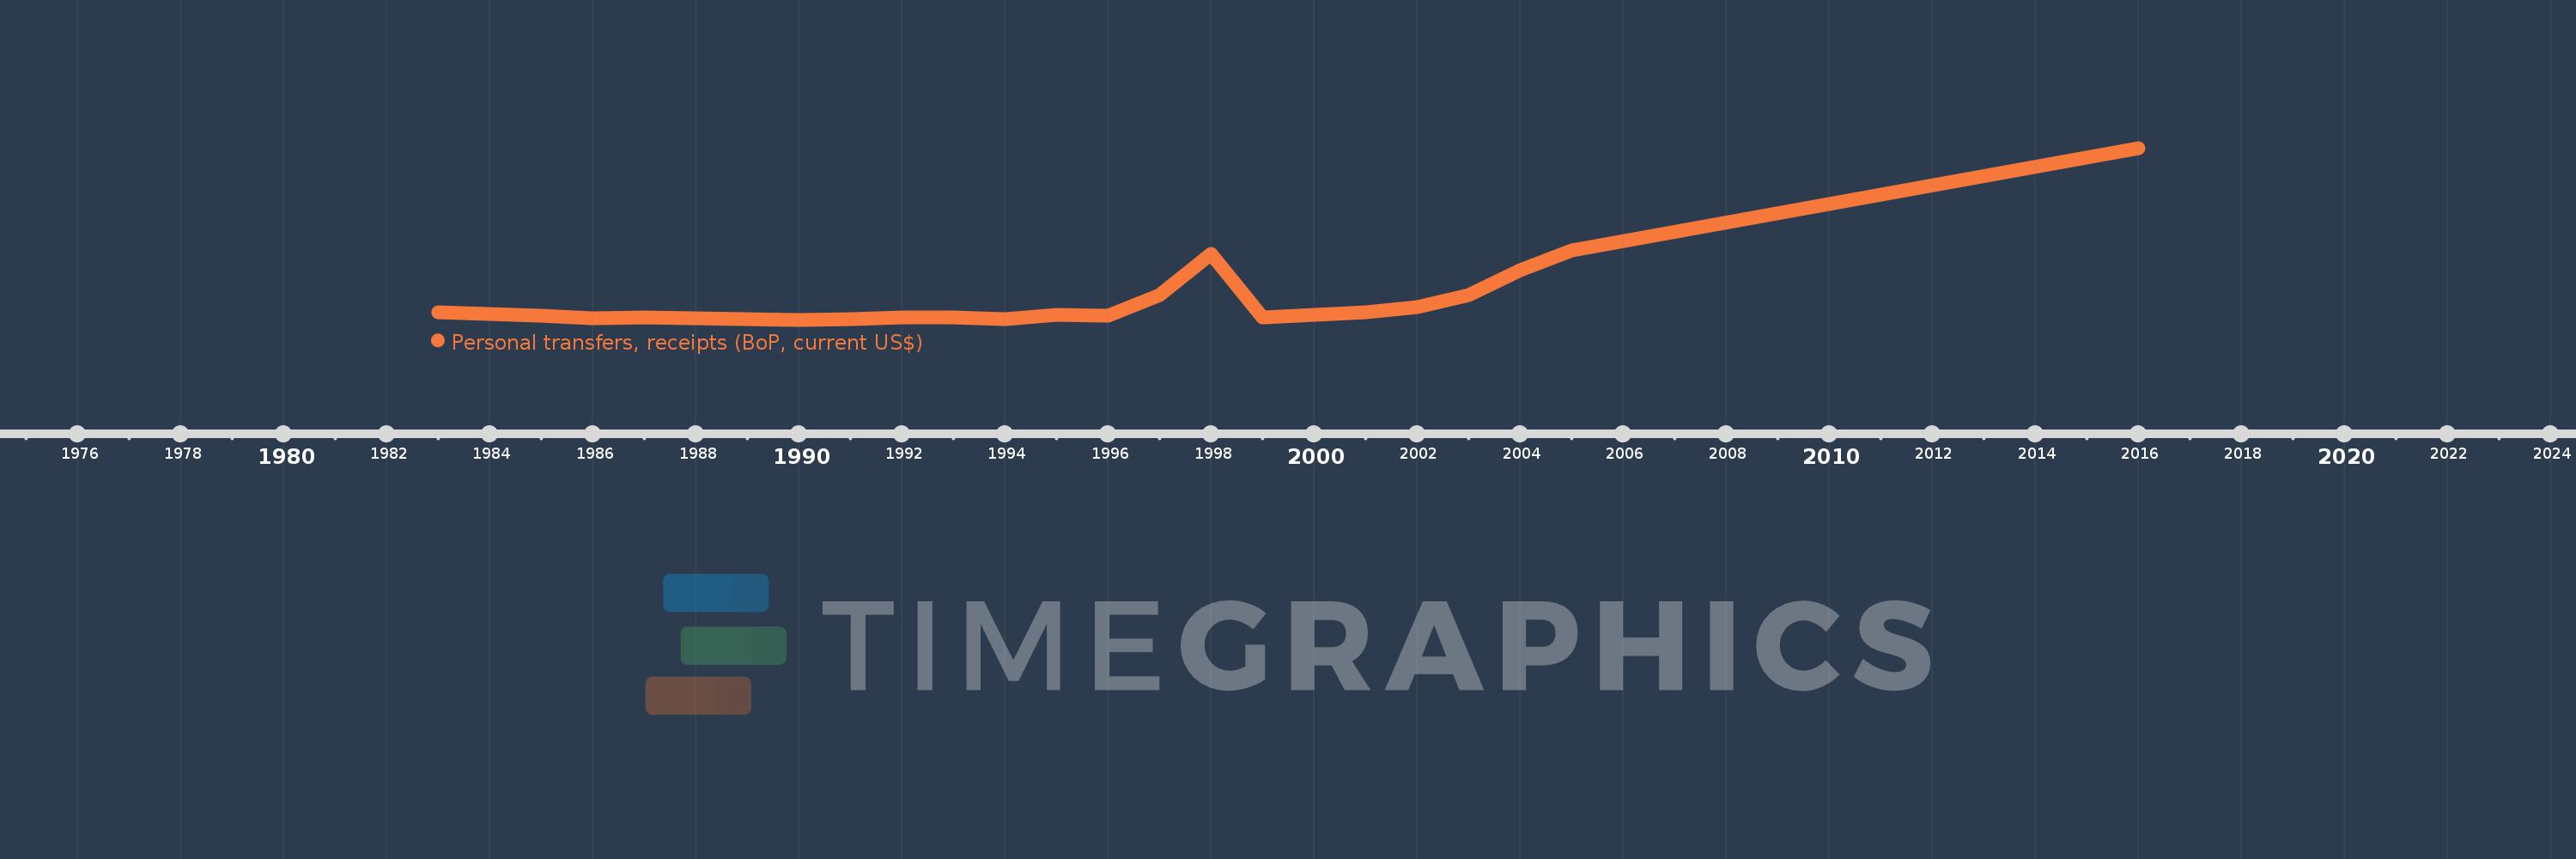
Cette échelle de temps montre un graphique de 1983 année à 2016 année China. Les données jusqu'à 1982 année ne sont pas présentés. Quantité d'observations actuelles selon dates: 24.
Source (désignation):
Les indicateurs du développement mondiale
Source (organisation):
International Monetary Fund, Balance of Payments Statistics Yearbook and data files.
Catégories:
Economy & Growth, Financial Sector
Dernière mise à jour
23 avr. 2017
Les indicateurs de changement de valeurs selon les années
En moyenne:
1.361 mds
Minimum:
76.0 mln.
1 janv. 1990
Maximum:
11.341 mds
1 janv. 2016
Pour la date d''observation
Valeur
Changement absolu
Le changement par rapport à la valeur précédente
1 janv. 1983
541.0 mln.
+541.0 mln.
0.0%
1 janv. 1984
446.0 mln.
-95.0 mln.
-17.56%
1 janv. 1985
317.0 mln.
-129.0 mln.
-28.92%
1 janv. 1986
180.0 mln.
-137.0 mln.
-43.22%
1 janv. 1987
208.0 mln.
+28.0 mln.
15.56%
1 janv. 1988
166.0 mln.
-42.0 mln.
-20.19%
1 janv. 1989
129.0 mln.
-37.0 mln.
-22.29%
1 janv. 1990
76.0 mln.
-53.0 mln.
-41.09%
1 janv. 1991
124.0 mln.
+48.0 mln.
63.16%
1 janv. 1992
207.0 mln.
+83.0 mln.
66.94%
1 janv. 1993
228.0 mln.
+21.0 mln.
10.14%
1 janv. 1994
108.0 mln.
-120.0 mln.
-52.63%
1 janv. 1995
395.0 mln.
+287.0 mln.
265.74%
1 janv. 1996
350.0 mln.
-45.0 mln.
-11.39%
1 janv. 1997
1.672 mds
+1.322 mds
377.71%
1 janv. 1998
4.423 mds
+2.751 mds
164.53%
1 janv. 1999
247.0 mln.
-4.176 mds
-94.42%
1 janv. 2000
384.0 mln.
+137.0 mln.
55.47%
1 janv. 2001
556.211 mln.
+172.211 mln.
44.85%
1 janv. 2002
912.0 mln.
+355.789 mln.
63.97%
1 janv. 2003
1.679 mds
+767.318 mln.
84.14%
1 janv. 2004
3.343 mds
+1.663 mds
99.05%
1 janv. 2005
4.627 mds
+1.284 mds
38.42%
1 janv. 2016
11.341 mds
+6.714 mds
145.1%
Classement des pays selon les statistiques actuelles par années

Commentaires:

Envoyer
PremiumAbout & FeedbackUn accordConfidentialité
logo
© 2022 Selected Technologies LLC – Morgan Hill, California