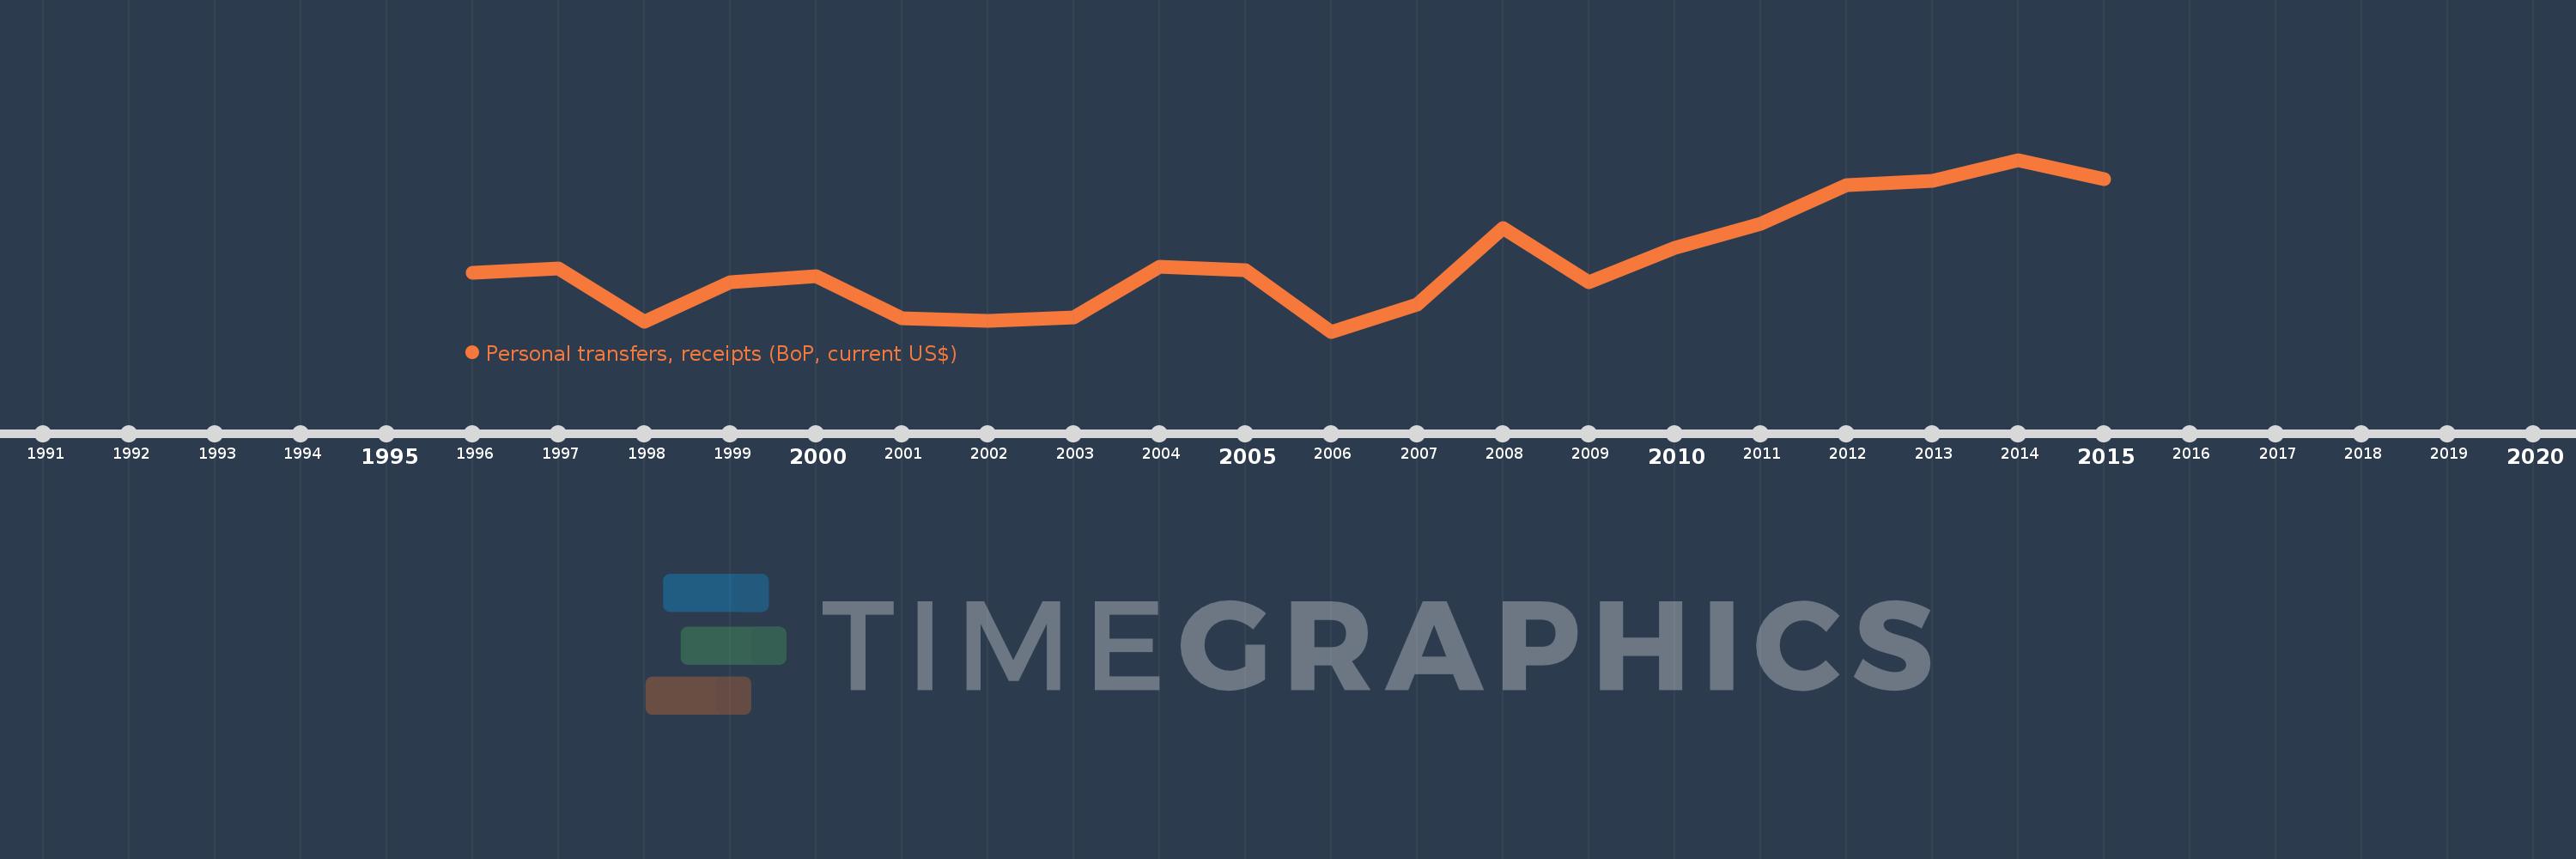
Cette échelle de temps montre un graphique de 1996 année à 2015 année Sierra Leone. Les données jusqu'à 1995 année ne sont pas présentés. Quantité d'observations actuelles selon dates: 20.
Source (désignation):
Les indicateurs du développement mondiale
Source (organisation):
International Monetary Fund, Balance of Payments Statistics Yearbook and data files.
Catégories:
Economy & Growth, Financial Sector
Dernière mise à jour
23 avr. 2017
Les indicateurs de changement de valeurs selon les années
En moyenne:
27.633 mln.
Minimum:
2.349 mln.
1 janv. 2006
Maximum:
64.761 mln.
1 janv. 2014
Pour la date d''observation
Valeur
Changement absolu
Le changement par rapport à la valeur précédente
1 janv. 1996
23.674 mln.
+23.674 mln.
0.0%
1 janv. 1997
25.247 mln.
+1.573 mln.
6.64%
1 janv. 1998
5.985 mln.
-19.262 mln.
-76.3%
1 janv. 1999
20.331 mln.
+14.346 mln.
239.71%
1 janv. 2000
22.477 mln.
+2.146 mln.
10.56%
1 janv. 2001
7.135 mln.
-15.342 mln.
-68.26%
1 janv. 2002
6.215 mln.
-919.716 milles
-12.89%
1 janv. 2003
7.454 mln.
+1.239 mln.
19.93%
1 janv. 2004
25.772 mln.
+18.318 mln.
245.75%
1 janv. 2005
24.641 mln.
-1.131 mln.
-4.39%
1 janv. 2006
2.349 mln.
-22.292 mln.
-90.47%
1 janv. 2007
12.076 mln.
+9.727 mln.
414.17%
1 janv. 2008
39.836 mln.
+27.76 mln.
229.88%
1 janv. 2009
20.228 mln.
-19.607 mln.
-49.22%
1 janv. 2010
32.668 mln.
+12.439 mln.
61.49%
1 janv. 2011
41.569 mln.
+8.901 mln.
27.25%
1 janv. 2012
55.51 mln.
+13.942 mln.
33.54%
1 janv. 2013
57.0 mln.
+1.49 mln.
2.68%
1 janv. 2014
64.761 mln.
+7.761 mln.
13.62%
1 janv. 2015
57.738 mln.
-7.023 mln.
-10.84%
Classement des pays selon les statistiques actuelles par années