29
/fr/
fr
AIzaSyAYiBZKx7MnpbEhh9jyipgxe19OcubqV5w
April 1, 2024
65204
Albania
ALB
true
2
1
Personal transfers, receipts (BoP, current US$)
2016,2015,2014,2013,2012,2011,2010,2009,2008,2007,2006,2005,2004,2003,2002,2001,2000,1999,1998,1997,1996,1995,1994,1993
Download
Bibliothèque de statistiques globales →Albania →

Personal transfers, receipts (BoP, current US$)

Cette statistique dans les autres pays:
AfghanistanAlbaniaAlgeriaAngolaAntigua and BarbudaArgentinaArmeniaArubaAustriaAzerbaijanBangladeshBarbadosBelarusBelgiumBelizeBeninBermudaBhutanBoliviaBosnia and HerzegovinaBotswanaBrazilBulgariaBurkina FasoBurundiCabo VerdeCambodiaCameroonCaribbean small statesCentral Europe and the BalticsChadChinaColombiaComorosCongo, Rep.Costa RicaCote d'IvoireCroatiaCuracaoCyprusCzech RepublicDjiboutiDominicaDominican RepublicEarly-demographic dividendEast Asia & PacificEast Asia & Pacific (excluding high income)East Asia & Pacific (IDA & IBRD countries)EcuadorEgypt, Arab Rep.El SalvadorEstoniaEthiopiaEuro areaEurope & Central AsiaEurope & Central Asia (excluding high income)Europe & Central Asia (IDA & IBRD countries)European UnionFijiFragile and conflict affected situationsFranceFrench PolynesiaGabonGambia, TheGeorgiaGermanyGhanaGreeceGrenadaGuatemalaGuineaGuinea-BissauGuyanaHaitiHeavily indebted poor countries (HIPC)HondurasHungaryIBRD onlyIcelandIDA & IBRD totalIDA blendIDA onlyIDA totalIndiaIndonesiaIraqIrelandItalyJamaicaJapanJordanKazakhstanKenyaKiribatiKorea, Rep.KosovoKyrgyz RepublicLao PDRLate-demographic dividendLatin America & Caribbean Latin America & Caribbean (excluding high income)Latin America & the Caribbean (IDA & IBRD countries)LatviaLeast developed countries: UN classificationLebanonLesothoLiberiaLibyaLithuaniaLow & middle incomeLow incomeLower middle incomeLuxembourgMacao SAR, ChinaMacedonia, FYRMadagascarMalawiMaldivesMaliMaltaMarshall IslandsMauritaniaMexicoMicronesia, Fed. Sts.Middle East & North Africa (excluding high income)Middle East & North Africa (IDA & IBRD countries)Middle incomeMoldovaMongoliaMontenegroMoroccoMozambiqueMyanmarNamibiaNepalNetherlandsNew CaledoniaNew ZealandNicaraguaNigerNigeriaNorwayOECD membersOmanOther small statesPacific island small statesPakistanPalauPanamaPapua New GuineaParaguayPeruPhilippinesPolandPortugalPost-demographic dividendPre-demographic dividendQatarRomaniaRussian FederationRwandaSamoaSao Tome and PrincipeSenegalSerbiaSeychellesSierra LeoneSint Maarten (Dutch part)Slovak RepublicSloveniaSmall statesSolomon IslandsSouth AsiaSouth Asia (IDA & IBRD)SpainSri LankaSt. Kitts and NevisSt. LuciaSt. Vincent and the GrenadinesSub-Saharan Africa Sub-Saharan Africa (excluding high income)Sub-Saharan Africa (IDA & IBRD countries)SudanSurinameSwazilandSwedenSwitzerlandSyrian Arab RepublicTajikistanTanzaniaThailandTimor-LesteTogoTongaTrinidad and TobagoTunisiaTurkeyTuvaluUgandaUkraineUnited KingdomUpper middle incomeUruguayVanuatuVenezuela, RBWest Bank and GazaWorldYemen, Rep.ZambiaZimbabwe
La ligne de temps
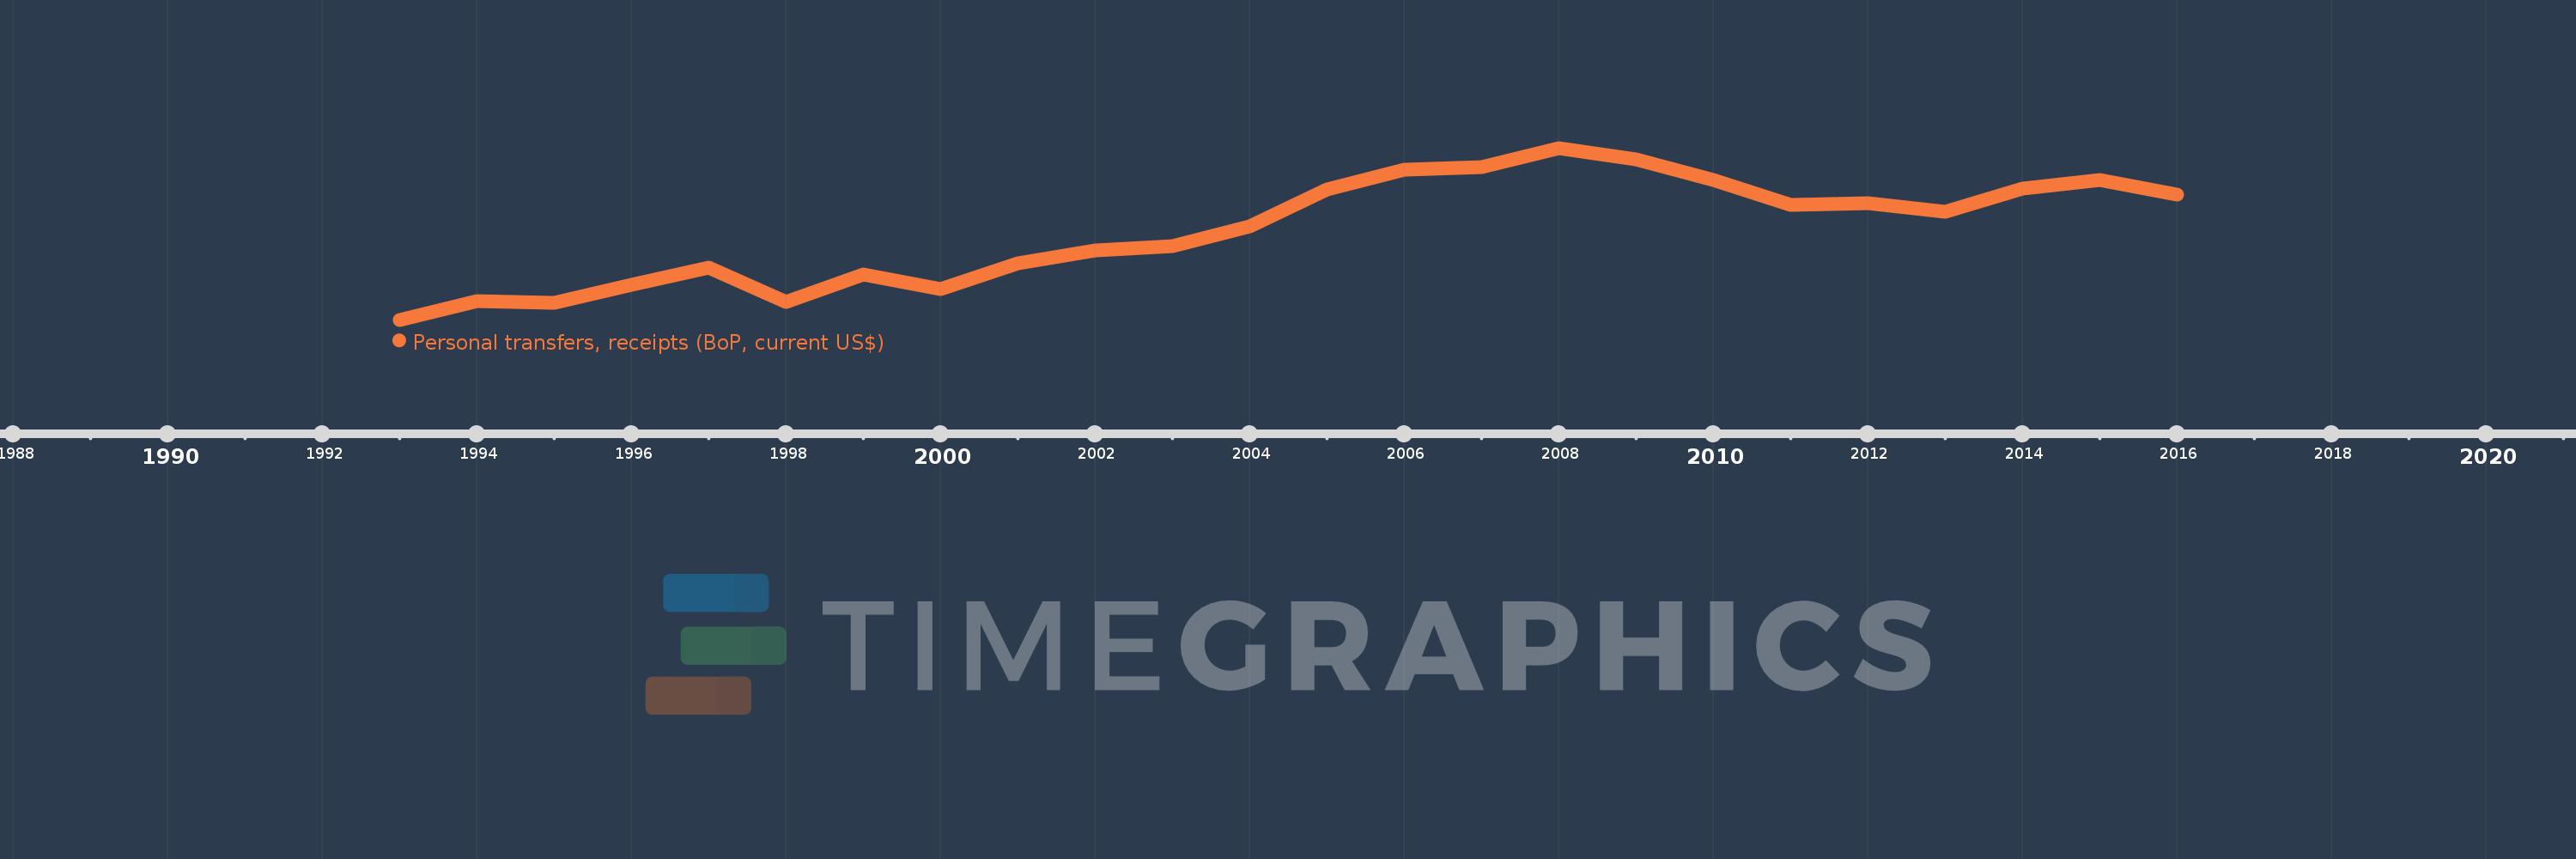
Cette échelle de temps montre un graphique de 1993 année à 2016 année Albania. Les données jusqu'à 1992 année ne sont pas présentés. Quantité d'observations actuelles selon dates: 24.
Source (désignation):
Les indicateurs du développement mondiale
Source (organisation):
International Monetary Fund, Balance of Payments Statistics Yearbook and data files.
Catégories:
Economy & Growth, Financial Sector
Dernière mise à jour
23 avr. 2017
Les indicateurs de changement de valeurs selon les années
En moyenne:
751.886 mln.
Minimum:
150.0 mln.
1 janv. 1993
Maximum:
1.305 mds
1 janv. 2008
Pour la date d''observation
Valeur
Changement absolu
Le changement par rapport à la valeur précédente
1 janv. 1993
150.0 mln.
+150.0 mln.
0.0%
1 janv. 1994
274.8 mln.
+124.8 mln.
83.2%
1 janv. 1995
264.7 mln.
-10.1 mln.
-3.68%
1 janv. 1996
384.6 mln.
+119.9 mln.
45.3%
1 janv. 1997
499.6 mln.
+115.0 mln.
29.9%
1 janv. 1998
266.9 mln.
-232.7 mln.
-46.58%
1 janv. 1999
452.27 mln.
+185.37 mln.
69.45%
1 janv. 2000
356.6 mln.
-95.67 mln.
-21.15%
1 janv. 2001
530.8 mln.
+174.2 mln.
48.85%
1 janv. 2002
614.9 mln.
+84.1 mln.
15.84%
1 janv. 2003
643.43 mln.
+28.53 mln.
4.64%
1 janv. 2004
778.114 mln.
+134.684 mln.
20.93%
1 janv. 2005
1.028 mds
+250.233 mln.
32.16%
1 janv. 2006
1.161 mds
+132.386 mln.
12.87%
1 janv. 2007
1.176 mds
+14.82 mln.
1.28%
1 janv. 2008
1.305 mds
+129.006 mln.
10.97%
1 janv. 2009
1.226 mds
-79.017 mln.
-6.06%
1 janv. 2010
1.091 mds
-134.344 mln.
-10.96%
1 janv. 2011
924.317 mln.
-166.882 mln.
-15.29%
1 janv. 2012
932.472 mln.
+8.155 mln.
0.88%
1 janv. 2013
874.765 mln.
-57.707 mln.
-6.19%
1 janv. 2014
1.03 mds
+155.504 mln.
17.78%
1 janv. 2015
1.09 mds
+59.262 mln.
5.75%
1 janv. 2016
991.261 mln.
-98.27 mln.
-9.02%
Classement des pays selon les statistiques actuelles par années

Commentaires:

Envoyer
PremiumAbout & FeedbackUn accordConfidentialité
logo
© 2022 Selected Technologies LLC – Morgan Hill, California