33
/fr/
AIzaSyAYiBZKx7MnpbEhh9jyipgxe19OcubqV5w
August 1, 2025
117311
Cyprus
CYP
true
2
1
Personal transfers, receipts (BoP, current US$)
2016,2015,2014,2013,2012,2011,2010,2009,2008,2007,2006,2005,2004,2003,1995,1994,1993,1992,1991,1990,1989,1988,1987
Download
Bibliothèque de statistiques globales →Cyprus →

Personal transfers, receipts (BoP, current US$)

Cette statistique dans les autres pays:

AfghanistanAlbaniaAlgeriaAngolaAntigua and BarbudaArgentinaArmeniaArubaAustriaAzerbaijanBangladeshBarbadosBelarusBelgiumBelizeBeninBermudaBhutanBoliviaBosnia and HerzegovinaBotswanaBrazilBulgariaBurkina FasoBurundiCabo VerdeCambodiaCameroonCaribbean small statesCentral Europe and the BalticsChadChinaColombiaComorosCongo, Rep.Costa RicaCote d'IvoireCroatiaCuracaoCyprusCzech RepublicDjiboutiDominicaDominican RepublicEarly-demographic dividendEast Asia & PacificEast Asia & Pacific (excluding high income)East Asia & Pacific (IDA & IBRD countries)EcuadorEgypt, Arab Rep.El SalvadorEstoniaEthiopiaEuro areaEurope & Central AsiaEurope & Central Asia (excluding high income)Europe & Central Asia (IDA & IBRD countries)European UnionFijiFragile and conflict affected situationsFranceFrench PolynesiaGabonGambia, TheGeorgiaGermanyGhanaGreeceGrenadaGuatemalaGuineaGuinea-BissauGuyanaHaitiHeavily indebted poor countries (HIPC)HondurasHungaryIBRD onlyIcelandIDA & IBRD totalIDA blendIDA onlyIDA totalIndiaIndonesiaIraqIrelandItalyJamaicaJapanJordanKazakhstanKenyaKiribatiKorea, Rep.KosovoKyrgyz RepublicLao PDRLate-demographic dividendLatin America & Caribbean Latin America & Caribbean (excluding high income)Latin America & the Caribbean (IDA & IBRD countries)LatviaLeast developed countries: UN classificationLebanonLesothoLiberiaLibyaLithuaniaLow & middle incomeLow incomeLower middle incomeLuxembourgMacao SAR, ChinaMacedonia, FYRMadagascarMalawiMaldivesMaliMaltaMarshall IslandsMauritaniaMexicoMicronesia, Fed. Sts.Middle East & North Africa (excluding high income)Middle East & North Africa (IDA & IBRD countries)Middle incomeMoldovaMongoliaMontenegroMoroccoMozambiqueMyanmarNamibiaNepalNetherlandsNew CaledoniaNew ZealandNicaraguaNigerNigeriaNorwayOECD membersOmanOther small statesPacific island small statesPakistanPalauPanamaPapua New GuineaParaguayPeruPhilippinesPolandPortugalPost-demographic dividendPre-demographic dividendQatarRomaniaRussian FederationRwandaSamoaSao Tome and PrincipeSenegalSerbiaSeychellesSierra LeoneSint Maarten (Dutch part)Slovak RepublicSloveniaSmall statesSolomon IslandsSouth AsiaSouth Asia (IDA & IBRD)SpainSri LankaSt. Kitts and NevisSt. LuciaSt. Vincent and the GrenadinesSub-Saharan Africa Sub-Saharan Africa (excluding high income)Sub-Saharan Africa (IDA & IBRD countries)SudanSurinameSwazilandSwedenSwitzerlandSyrian Arab RepublicTajikistanTanzaniaThailandTimor-LesteTogoTongaTrinidad and TobagoTunisiaTurkeyTuvaluUgandaUkraineUnited KingdomUpper middle incomeUruguayVanuatuVenezuela, RBWest Bank and GazaWorldYemen, Rep.ZambiaZimbabwe

La ligne de temps

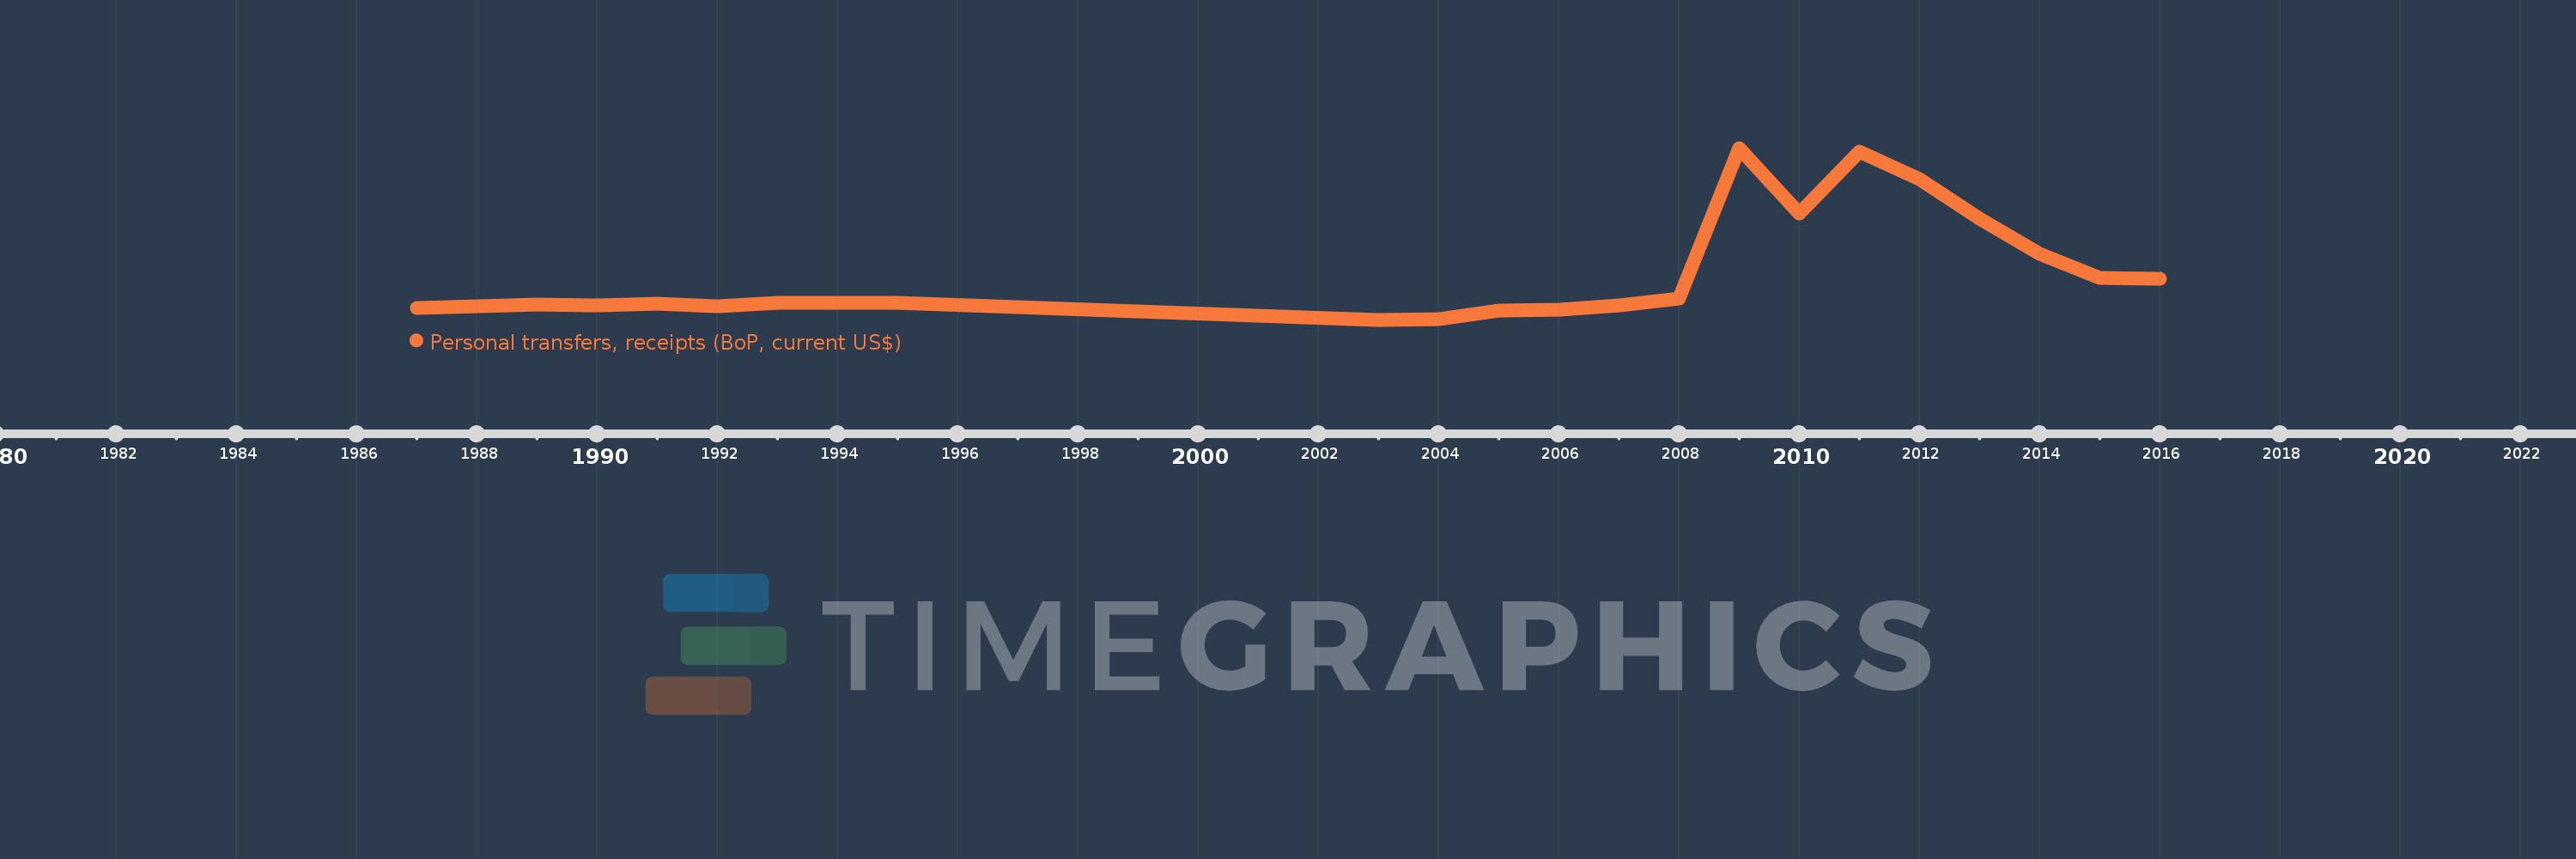
Cette échelle de temps montre un graphique de 1987 année à 2016 année Cyprus. Les données jusqu'à 1986 année ne sont pas présentés. Quantité d'observations actuelles selon dates: 23.

Source (désignation):

Les indicateurs du développement mondiale

Source (organisation):

International Monetary Fund, Balance of Payments Statistics Yearbook and data files.

Catégories:

Economy & Growth, Financial Sector

Dernière mise à jour

23 avr. 2017

Les indicateurs de changement de valeurs selon les années

En moyenne:
204.174 mln.
Minimum:
5.182 mln.
1 janv. 2003
Maximum:
772.0 mln.
1 janv. 2009
Pour la date d''observation
Valeur
Changement absolu
Le changement par rapport à la valeur précédente
1 janv. 1987
57.127 mln.
+57.127 mln.
0.0%
1 janv. 1988
63.813 mln.
+6.685 mln.
11.7%
1 janv. 1989
71.363 mln.
+7.55 mln.
11.83%
1 janv. 1990
68.941 mln.
-2.422 mln.
-3.39%
1 janv. 1991
78.589 mln.
+9.648 mln.
13.99%
1 janv. 1992
65.672 mln.
-12.917 mln.
-16.44%
1 janv. 1993
81.193 mln.
+15.52 mln.
23.63%
1 janv. 1994
79.412 mln.
-1.78 mln.
-2.19%
1 janv. 1995
81.269 mln.
+1.857 mln.
2.34%
1 janv. 2003
5.182 mln.
-76.087 mln.
-93.62%
1 janv. 2004
6.443 mln.
+1.261 mln.
24.34%
1 janv. 2005
44.317 mln.
+37.874 mln.
587.79%
1 janv. 2006
50.874 mln.
+6.557 mln.
14.79%
1 janv. 2007
69.947 mln.
+19.073 mln.
37.49%
1 janv. 2008
98.693 mln.
+28.746 mln.
41.1%
1 janv. 2009
772.0 mln.
+673.307 mln.
682.22%
1 janv. 2010
480.097 mln.
-291.904 mln.
-37.81%
1 janv. 2011
754.425 mln.
+274.328 mln.
57.14%
1 janv. 2012
633.123 mln.
-121.302 mln.
-16.08%
1 janv. 2013
455.598 mln.
-177.525 mln.
-28.04%
1 janv. 2014
298.053 mln.
-157.545 mln.
-34.58%
1 janv. 2015
193.43 mln.
-104.622 mln.
-35.1%
1 janv. 2016
186.442 mln.
-6.989 mln.
-3.61%

Classement des pays selon les statistiques actuelles par années