33
/fr/
AIzaSyAYiBZKx7MnpbEhh9jyipgxe19OcubqV5w
August 1, 2025
83522
Belize
BLZ
true
2
1
Tax revenue (current LCU)
2015,2014,2013,2012,2011,2010,2009,2008,2007,2006,2005,2004,2003,2002,2001,2000,1999,1998,1997,1996,1995,1994,1993,1992,1991
Download
Bibliothèque de statistiques globales →Belize →

Tax revenue (current LCU)

Cette statistique dans les autres pays:

AfghanistanAlbaniaAlgeriaAngolaAntigua and BarbudaArgentinaArmeniaAustraliaAustriaAzerbaijanBahamas, TheBahrainBangladeshBarbadosBelarusBelgiumBelizeBeninBhutanBoliviaBosnia and HerzegovinaBotswanaBrazilBulgariaBurkina FasoBurundiCabo VerdeCambodiaCanadaCentral African RepublicChileChinaColombiaCongo, Dem. Rep.Congo, Rep.Costa RicaCote d'IvoireCroatiaCyprusCzech RepublicDenmarkDominicaDominican RepublicEgypt, Arab Rep.El SalvadorEquatorial GuineaEstoniaEthiopiaFijiFinlandFranceGambia, TheGeorgiaGermanyGhanaGreeceGrenadaGuatemalaHondurasHong Kong SAR, ChinaHungaryIcelandIndiaIndonesiaIran, Islamic Rep.IraqIrelandIsraelItalyJamaicaJapanJordanKazakhstanKenyaKiribatiKorea, Rep.KuwaitKyrgyz RepublicLao PDRLatviaLebanonLesothoLiberiaLithuaniaLuxembourgMacao SAR, ChinaMacedonia, FYRMadagascarMalawiMalaysiaMaldivesMaliMaltaMauritiusMexicoMicronesia, Fed. Sts.MoldovaMongoliaMoroccoMozambiqueMyanmarNamibiaNepalNetherlandsNew ZealandNicaraguaNigeriaNorwayOmanPakistanPanamaPapua New GuineaParaguayPeruPhilippinesPolandPortugalQatarRomaniaRussian FederationRwandaSamoaSan MarinoSao Tome and PrincipeSenegalSerbiaSeychellesSierra LeoneSingaporeSlovak RepublicSloveniaSolomon IslandsSouth AfricaSpainSri LankaSt. Kitts and NevisSt. LuciaSt. Vincent and the GrenadinesSurinameSwazilandSwedenSwitzerlandSyrian Arab RepublicTajikistanTanzaniaThailandTimor-LesteTogoTrinidad and TobagoTunisiaTurkeyUgandaUkraineUnited Arab EmiratesUnited KingdomUnited StatesUruguayVanuatuVenezuela, RBVietnamWest Bank and GazaYemen, Rep.ZambiaZimbabwe

La ligne de temps

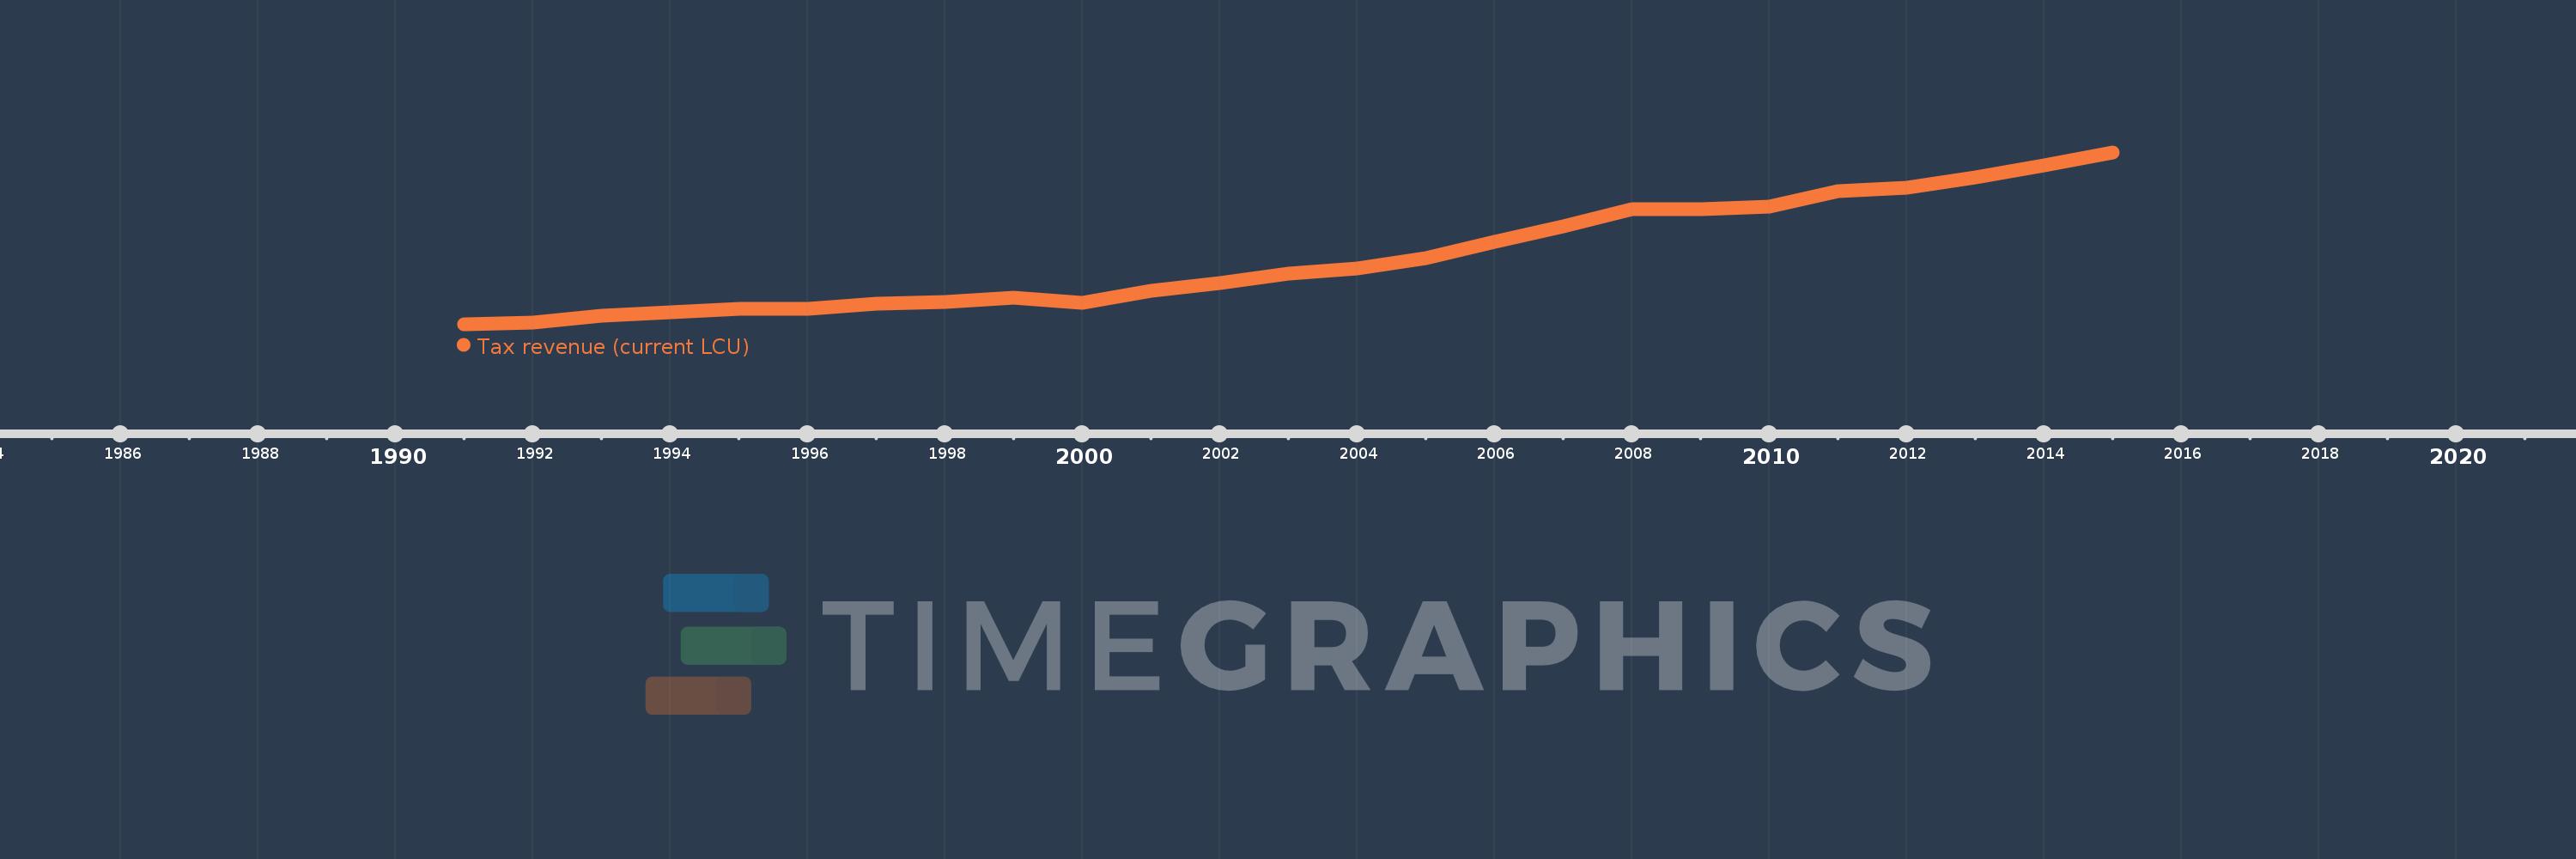
Cette échelle de temps montre un graphique de 1991 année à 2015 année Belize. Les données jusqu'à 1990 année ne sont pas présentés. Quantité d'observations actuelles selon dates: 25.

Source (désignation):

Les indicateurs du développement mondiale

Source (organisation):

International Monetary Fund, Government Finance Statistics Yearbook and data files.

Catégories:

Public Sector

Dernière mise à jour

23 avr. 2017

Les indicateurs de changement de valeurs selon les années

En moyenne:
417.724 mln.
Minimum:
176.836 mln.
1 janv. 1991
Maximum:
798.316 mln.
1 janv. 2015
Pour la date d''observation
Valeur
Changement absolu
Le changement par rapport à la valeur précédente
1 janv. 1991
176.836 mln.
+176.836 mln.
0.0%
1 janv. 1992
184.212 mln.
+7.376 mln.
4.17%
1 janv. 1993
206.628 mln.
+22.416 mln.
12.17%
1 janv. 1994
218.59 mln.
+11.962 mln.
5.79%
1 janv. 1995
231.371 mln.
+12.781 mln.
5.85%
1 janv. 1996
232.589 mln.
+1.218 mln.
0.53%
1 janv. 1997
250.638 mln.
+18.049 mln.
7.76%
1 janv. 1998
257.214 mln.
+6.576 mln.
2.62%
1 janv. 1999
271.441 mln.
+14.227 mln.
5.53%
1 janv. 2000
255.013 mln.
-16.428 mln.
-6.05%
1 janv. 2001
296.677 mln.
+41.664 mln.
16.34%
1 janv. 2002
326.111 mln.
+29.434 mln.
9.92%
1 janv. 2003
359.961 mln.
+33.85 mln.
10.38%
1 janv. 2004
379.795 mln.
+19.834 mln.
5.51%
1 janv. 2005
416.017 mln.
+36.222 mln.
9.54%
1 janv. 2006
474.746 mln.
+58.729 mln.
14.12%
1 janv. 2007
530.429 mln.
+55.683 mln.
11.73%
1 janv. 2008
591.664 mln.
+61.235 mln.
11.54%
1 janv. 2009
593.959 mln.
+2.295 mln.
0.39%
1 janv. 2010
601.126 mln.
+7.167 mln.
1.21%
1 janv. 2011
659.344 mln.
+58.218 mln.
9.68%
1 janv. 2012
671.122 mln.
+11.778 mln.
1.79%
1 janv. 2013
706.803 mln.
+35.681 mln.
5.32%
1 janv. 2014
752.494 mln.
+45.691 mln.
6.46%
1 janv. 2015
798.316 mln.
+45.822 mln.
6.09%

Classement des pays selon les statistiques actuelles par années