29
/fr/
fr
AIzaSyAYiBZKx7MnpbEhh9jyipgxe19OcubqV5w
April 1, 2024
238790
Seychelles
SYC
true
2
1
Tax revenue (current LCU)
2015,2014,2013,2012,2011,2010,2009,2008,2007,2006,2005,2004,2003,2002,2001,2000,1999,1998,1997,1996,1995,1994,1990,1989,1988,1987,1986
Download
Bibliothèque de statistiques globales →Seychelles →

Tax revenue (current LCU)

Cette statistique dans les autres pays:
AfghanistanAlbaniaAlgeriaAngolaAntigua and BarbudaArgentinaArmeniaAustraliaAustriaAzerbaijanBahamas, TheBahrainBangladeshBarbadosBelarusBelgiumBelizeBeninBhutanBoliviaBosnia and HerzegovinaBotswanaBrazilBulgariaBurkina FasoBurundiCabo VerdeCambodiaCanadaCentral African RepublicChileChinaColombiaCongo, Dem. Rep.Congo, Rep.Costa RicaCote d'IvoireCroatiaCyprusCzech RepublicDenmarkDominicaDominican RepublicEgypt, Arab Rep.El SalvadorEquatorial GuineaEstoniaEthiopiaFijiFinlandFranceGambia, TheGeorgiaGermanyGhanaGreeceGrenadaGuatemalaHondurasHong Kong SAR, ChinaHungaryIcelandIndiaIndonesiaIran, Islamic Rep.IraqIrelandIsraelItalyJamaicaJapanJordanKazakhstanKenyaKiribatiKorea, Rep.KuwaitKyrgyz RepublicLao PDRLatviaLebanonLesothoLiberiaLithuaniaLuxembourgMacao SAR, ChinaMacedonia, FYRMadagascarMalawiMalaysiaMaldivesMaliMaltaMauritiusMexicoMicronesia, Fed. Sts.MoldovaMongoliaMoroccoMozambiqueMyanmarNamibiaNepalNetherlandsNew ZealandNicaraguaNigeriaNorwayOmanPakistanPanamaPapua New GuineaParaguayPeruPhilippinesPolandPortugalQatarRomaniaRussian FederationRwandaSamoaSan MarinoSao Tome and PrincipeSenegalSerbiaSeychellesSierra LeoneSingaporeSlovak RepublicSloveniaSolomon IslandsSouth AfricaSpainSri LankaSt. Kitts and NevisSt. LuciaSt. Vincent and the GrenadinesSurinameSwazilandSwedenSwitzerlandSyrian Arab RepublicTajikistanTanzaniaThailandTimor-LesteTogoTrinidad and TobagoTunisiaTurkeyUgandaUkraineUnited Arab EmiratesUnited KingdomUnited StatesUruguayVanuatuVenezuela, RBVietnamWest Bank and GazaYemen, Rep.ZambiaZimbabwe
La ligne de temps
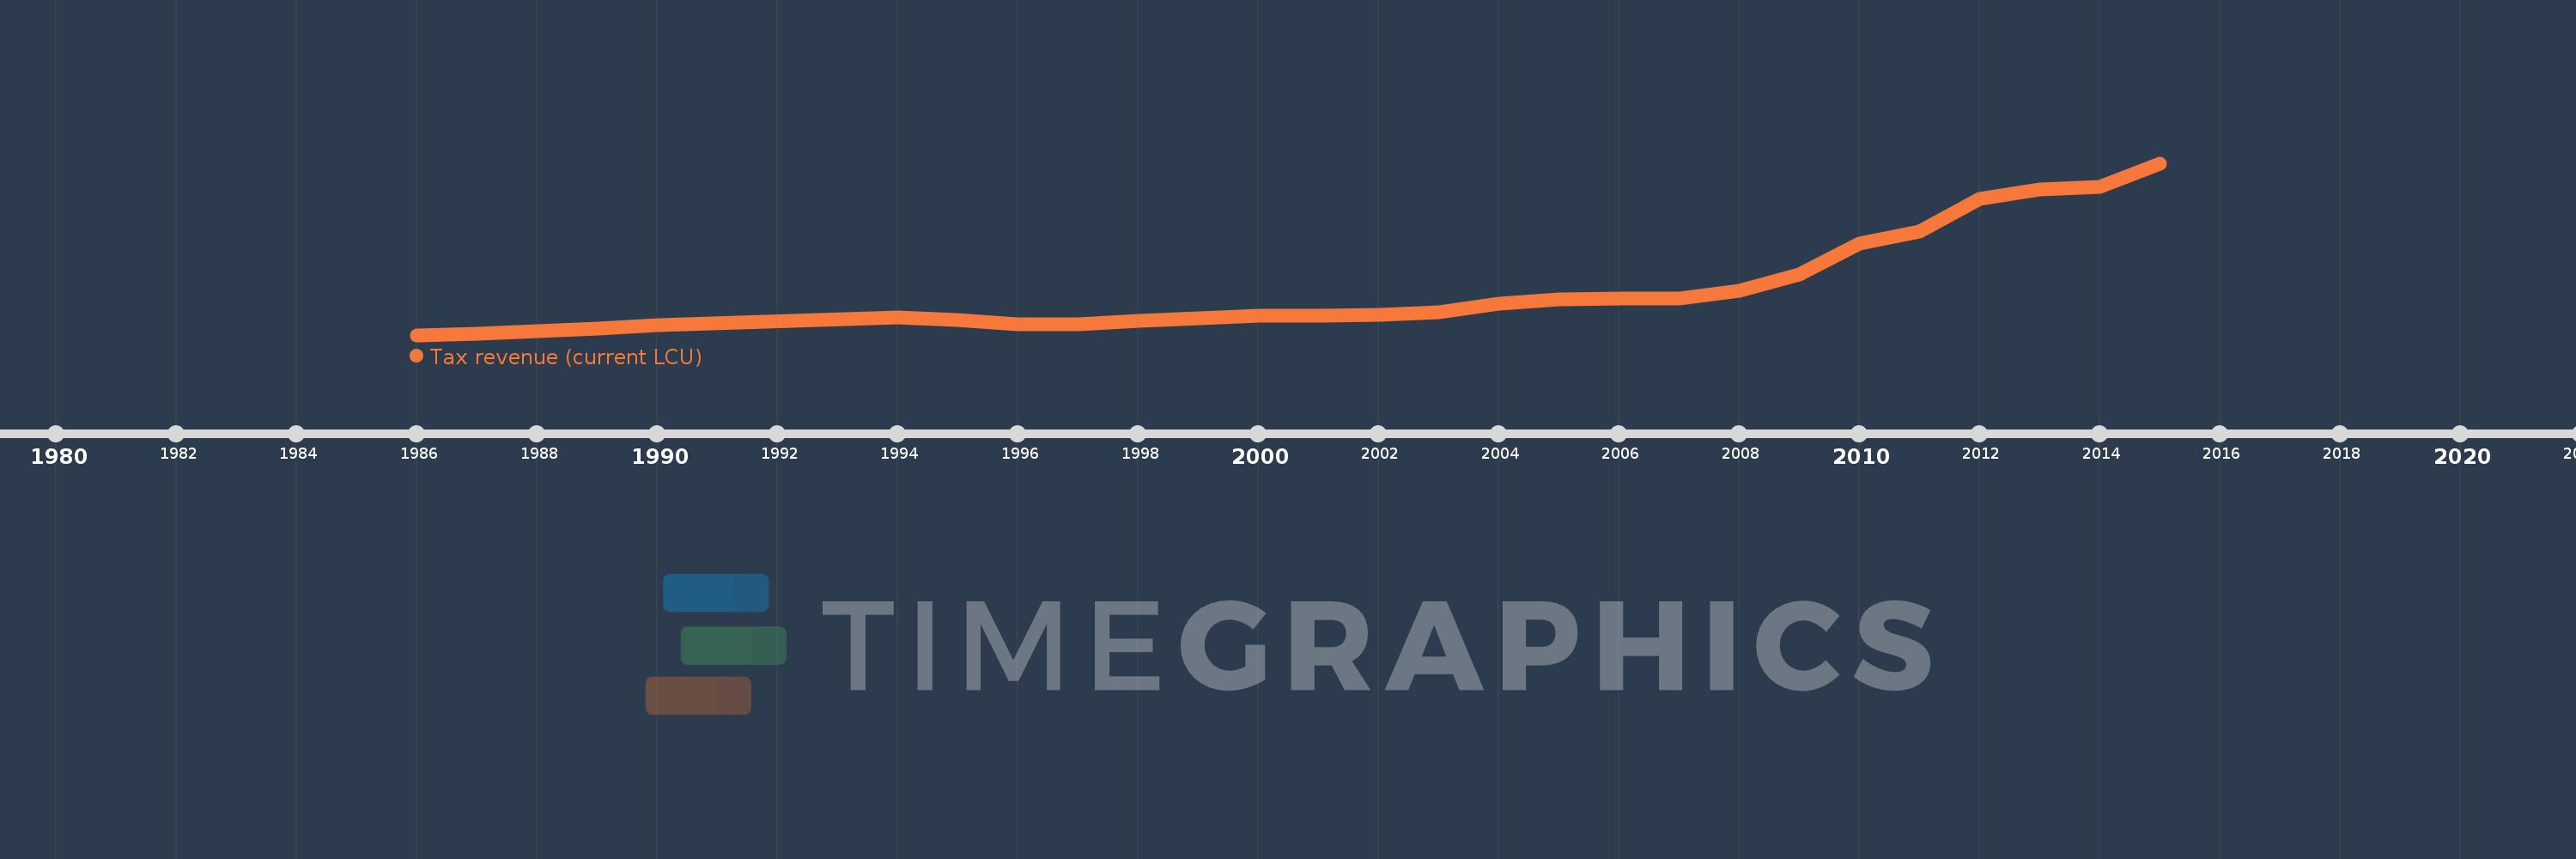
Cette échelle de temps montre un graphique de 1986 année à 2015 année Seychelles. Les données jusqu'à 1985 année ne sont pas présentés. Quantité d'observations actuelles selon dates: 27.
Source (désignation):
Les indicateurs du développement mondiale
Source (organisation):
International Monetary Fund, Government Finance Statistics Yearbook and data files.
Catégories:
Public Sector
Dernière mise à jour
23 avr. 2017
Les indicateurs de changement de valeurs selon les années
En moyenne:
1.638 mds
Minimum:
369.4 mln.
1 janv. 1986
Maximum:
5.15 mds
1 janv. 2015
Pour la date d''observation
Valeur
Changement absolu
Le changement par rapport à la valeur précédente
1 janv. 1986
369.4 mln.
+369.4 mln.
0.0%
1 janv. 1987
410.3 mln.
+40.9 mln.
11.07%
1 janv. 1988
486.6 mln.
+76.3 mln.
18.6%
1 janv. 1989
550.0 mln.
+63.4 mln.
13.03%
1 janv. 1990
633.1 mln.
+83.1 mln.
15.11%
1 janv. 1994
868.3 mln.
+235.2 mln.
37.15%
1 janv. 1995
786.2 mln.
-82.1 mln.
-9.46%
1 janv. 1996
668.8 mln.
-117.4 mln.
-14.93%
1 janv. 1997
673.5 mln.
+4.7 mln.
0.7%
1 janv. 1998
763.0 mln.
+89.5 mln.
13.29%
1 janv. 1999
846.3 mln.
+83.3 mln.
10.92%
1 janv. 2000
905.9 mln.
+59.6 mln.
7.04%
1 janv. 2001
916.3 mln.
+10.4 mln.
1.15%
1 janv. 2002
920.6 mln.
+4.3 mln.
0.47%
1 janv. 2003
999.1 mln.
+78.5 mln.
8.53%
1 janv. 2004
1.247 mds
+248.3 mln.
24.85%
1 janv. 2005
1.363 mds
+115.1 mln.
9.23%
1 janv. 2006
1.38 mds
+17.534 mln.
1.29%
1 janv. 2007
1.385 mds
+5.298 mln.
0.38%
1 janv. 2008
1.61 mds
+225.05 mln.
16.25%
1 janv. 2009
2.046 mds
+435.609 mln.
27.05%
1 janv. 2010
2.911 mds
+865.135 mln.
42.28%
1 janv. 2011
3.26 mds
+348.88 mln.
11.98%
1 janv. 2012
4.156 mds
+895.556 mln.
27.47%
1 janv. 2013
4.415 mds
+259.08 mln.
6.23%
1 janv. 2014
4.495 mds
+80.005 mln.
1.81%
1 janv. 2015
5.15 mds
+655.229 mln.
14.58%
Classement des pays selon les statistiques actuelles par années

Commentaires:

Envoyer
PremiumAbout & FeedbackUn accordConfidentialité
logo
© 2022 Selected Technologies LLC – Morgan Hill, California