33
/fr/
AIzaSyAYiBZKx7MnpbEhh9jyipgxe19OcubqV5w
August 1, 2025
143610
Grenada
GRD
true
2
1
Tax revenue (current LCU)
2015,2014,2013,2012,2011,2010,2009,2008,2007,2006,2005,2004,2003,2002,2001,2000,1996,1995,1994,1993,1992
Download
Bibliothèque de statistiques globales →Grenada →

Tax revenue (current LCU)

Cette statistique dans les autres pays:

AfghanistanAlbaniaAlgeriaAngolaAntigua and BarbudaArgentinaArmeniaAustraliaAustriaAzerbaijanBahamas, TheBahrainBangladeshBarbadosBelarusBelgiumBelizeBeninBhutanBoliviaBosnia and HerzegovinaBotswanaBrazilBulgariaBurkina FasoBurundiCabo VerdeCambodiaCanadaCentral African RepublicChileChinaColombiaCongo, Dem. Rep.Congo, Rep.Costa RicaCote d'IvoireCroatiaCyprusCzech RepublicDenmarkDominicaDominican RepublicEgypt, Arab Rep.El SalvadorEquatorial GuineaEstoniaEthiopiaFijiFinlandFranceGambia, TheGeorgiaGermanyGhanaGreeceGrenadaGuatemalaHondurasHong Kong SAR, ChinaHungaryIcelandIndiaIndonesiaIran, Islamic Rep.IraqIrelandIsraelItalyJamaicaJapanJordanKazakhstanKenyaKiribatiKorea, Rep.KuwaitKyrgyz RepublicLao PDRLatviaLebanonLesothoLiberiaLithuaniaLuxembourgMacao SAR, ChinaMacedonia, FYRMadagascarMalawiMalaysiaMaldivesMaliMaltaMauritiusMexicoMicronesia, Fed. Sts.MoldovaMongoliaMoroccoMozambiqueMyanmarNamibiaNepalNetherlandsNew ZealandNicaraguaNigeriaNorwayOmanPakistanPanamaPapua New GuineaParaguayPeruPhilippinesPolandPortugalQatarRomaniaRussian FederationRwandaSamoaSan MarinoSao Tome and PrincipeSenegalSerbiaSeychellesSierra LeoneSingaporeSlovak RepublicSloveniaSolomon IslandsSouth AfricaSpainSri LankaSt. Kitts and NevisSt. LuciaSt. Vincent and the GrenadinesSurinameSwazilandSwedenSwitzerlandSyrian Arab RepublicTajikistanTanzaniaThailandTimor-LesteTogoTrinidad and TobagoTunisiaTurkeyUgandaUkraineUnited Arab EmiratesUnited KingdomUnited StatesUruguayVanuatuVenezuela, RBVietnamWest Bank and GazaYemen, Rep.ZambiaZimbabwe

La ligne de temps

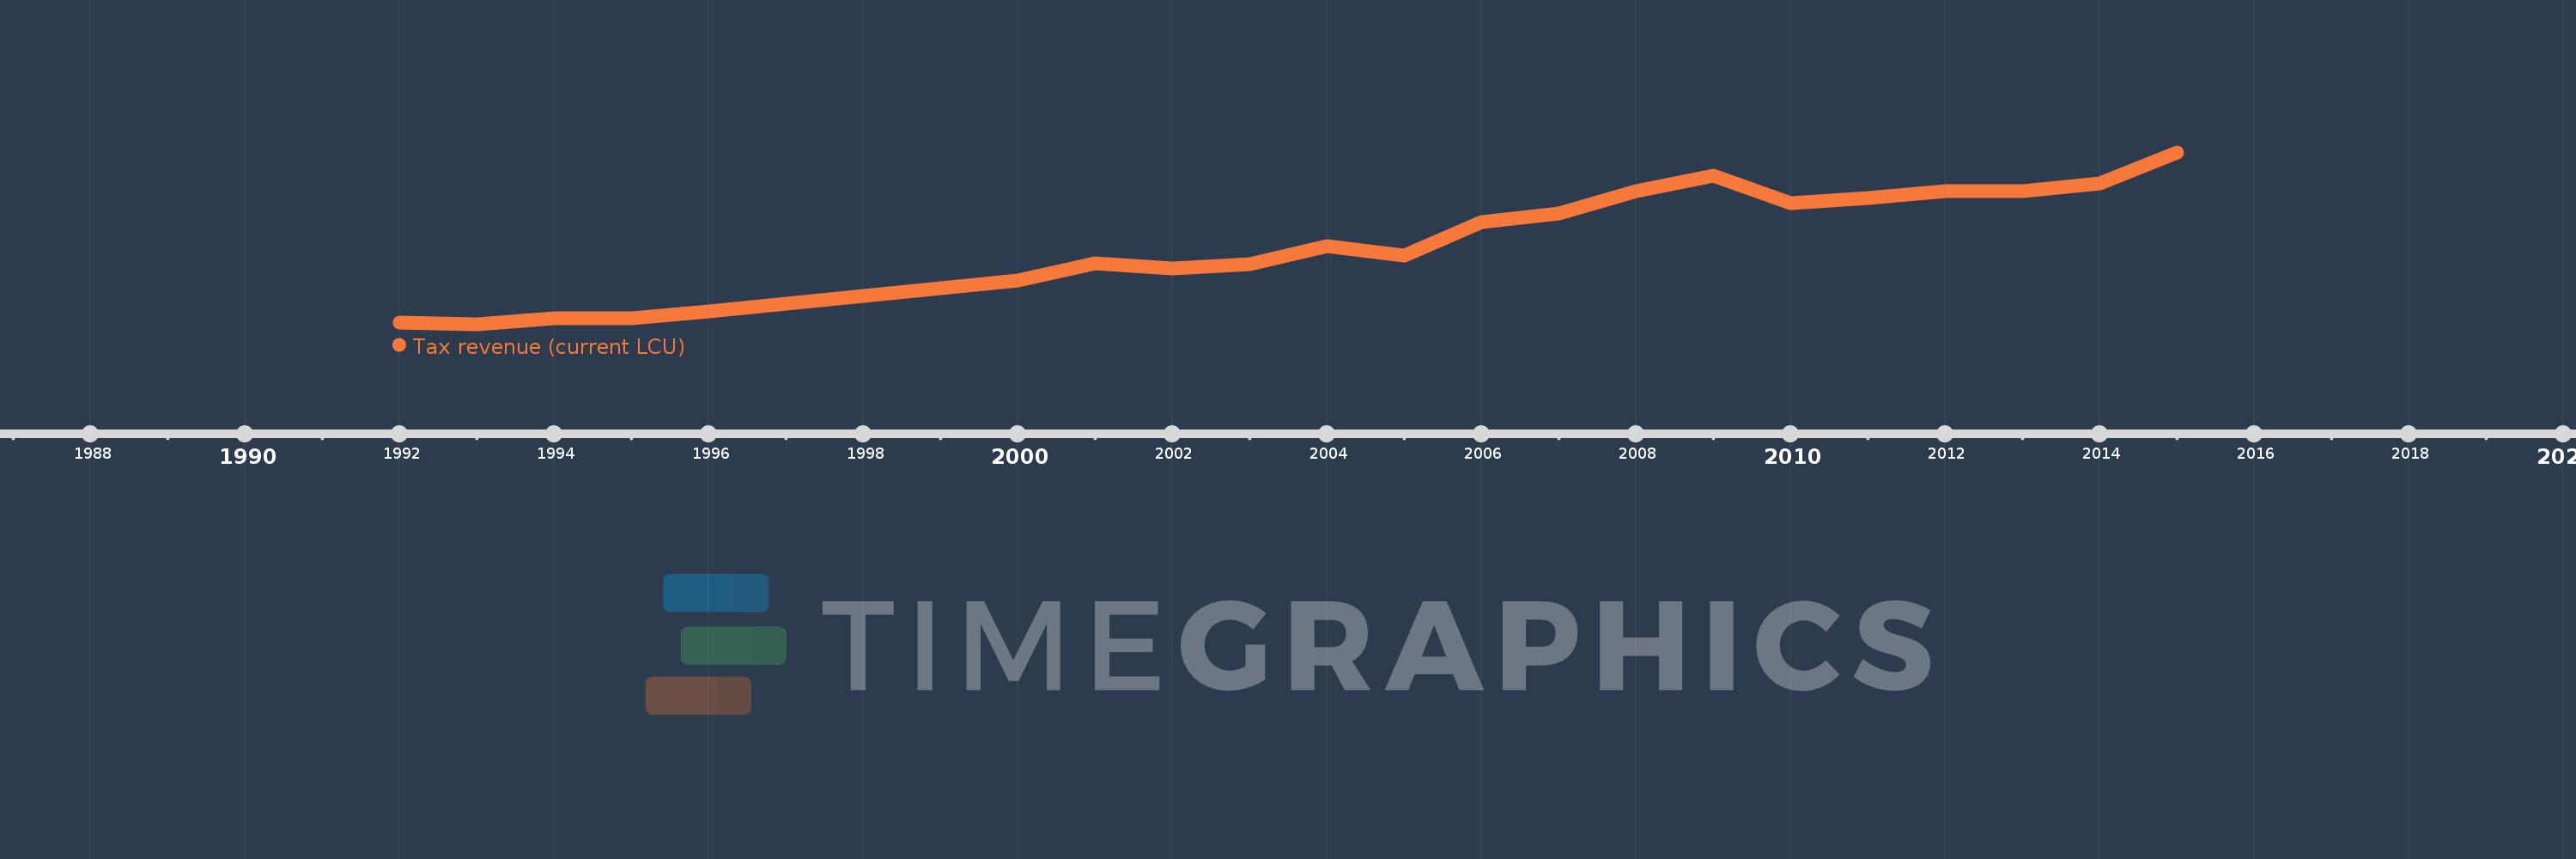
Cette échelle de temps montre un graphique de 1992 année à 2015 année Grenada. Les données jusqu'à 1991 année ne sont pas présentés. Quantité d'observations actuelles selon dates: 21.

Source (désignation):

Les indicateurs du développement mondiale

Source (organisation):

International Monetary Fund, Government Finance Statistics Yearbook and data files.

Catégories:

Public Sector

Dernière mise à jour

23 avr. 2017

Les indicateurs de changement de valeurs selon les années

En moyenne:
304.382 mln.
Minimum:
147.12 mln.
1 janv. 1993
Maximum:
478.154 mln.
1 janv. 2015
Pour la date d''observation
Valeur
Changement absolu
Le changement par rapport à la valeur précédente
1 janv. 1992
150.32 mln.
+150.32 mln.
0.0%
1 janv. 1993
147.12 mln.
-3.2 mln.
-2.13%
1 janv. 1994
158.94 mln.
+11.82 mln.
8.03%
1 janv. 1995
157.87 mln.
-1.07 mln.
-0.67%
1 janv. 1996
172.2 mln.
+14.33 mln.
9.08%
1 janv. 2000
232.0 mln.
+59.8 mln.
34.73%
1 janv. 2001
265.13 mln.
+33.13 mln.
14.28%
1 janv. 2002
254.57 mln.
-10.56 mln.
-3.98%
1 janv. 2003
262.41 mln.
+7.84 mln.
3.08%
1 janv. 2004
298.3 mln.
+35.89 mln.
13.68%
1 janv. 2005
279.505 mln.
-18.795 mln.
-6.3%
1 janv. 2006
343.886 mln.
+64.381 mln.
23.03%
1 janv. 2007
359.984 mln.
+16.098 mln.
4.68%
1 janv. 2008
402.83 mln.
+42.846 mln.
11.9%
1 janv. 2009
433.776 mln.
+30.946 mln.
7.68%
1 janv. 2010
379.937 mln.
-53.84 mln.
-12.41%
1 janv. 2011
389.893 mln.
+9.956 mln.
2.62%
1 janv. 2012
403.033 mln.
+13.14 mln.
3.37%
1 janv. 2013
403.181 mln.
+148.0 milles
0.04%
1 janv. 2014
418.984 mln.
+15.804 mln.
3.92%
1 janv. 2015
478.154 mln.
+59.17 mln.
14.12%

Classement des pays selon les statistiques actuelles par années