33
/fr/
AIzaSyAYiBZKx7MnpbEhh9jyipgxe19OcubqV5w
August 1, 2025
172257
Kuwait
KWT
true
2
1
Tax revenue (current LCU)
1999,1998,1997,1996,1995,1994,1993,1992,1991,1990,1989,1988,1987,1986,1985,1984,1983,1982,1981,1980,1979,1978,1975,1974,1973
Download
Bibliothèque de statistiques globales →Kuwait →

Tax revenue (current LCU)

Cette statistique dans les autres pays:

AfghanistanAlbaniaAlgeriaAngolaAntigua and BarbudaArgentinaArmeniaAustraliaAustriaAzerbaijanBahamas, TheBahrainBangladeshBarbadosBelarusBelgiumBelizeBeninBhutanBoliviaBosnia and HerzegovinaBotswanaBrazilBulgariaBurkina FasoBurundiCabo VerdeCambodiaCanadaCentral African RepublicChileChinaColombiaCongo, Dem. Rep.Congo, Rep.Costa RicaCote d'IvoireCroatiaCyprusCzech RepublicDenmarkDominicaDominican RepublicEgypt, Arab Rep.El SalvadorEquatorial GuineaEstoniaEthiopiaFijiFinlandFranceGambia, TheGeorgiaGermanyGhanaGreeceGrenadaGuatemalaHondurasHong Kong SAR, ChinaHungaryIcelandIndiaIndonesiaIran, Islamic Rep.IraqIrelandIsraelItalyJamaicaJapanJordanKazakhstanKenyaKiribatiKorea, Rep.KuwaitKyrgyz RepublicLao PDRLatviaLebanonLesothoLiberiaLithuaniaLuxembourgMacao SAR, ChinaMacedonia, FYRMadagascarMalawiMalaysiaMaldivesMaliMaltaMauritiusMexicoMicronesia, Fed. Sts.MoldovaMongoliaMoroccoMozambiqueMyanmarNamibiaNepalNetherlandsNew ZealandNicaraguaNigeriaNorwayOmanPakistanPanamaPapua New GuineaParaguayPeruPhilippinesPolandPortugalQatarRomaniaRussian FederationRwandaSamoaSan MarinoSao Tome and PrincipeSenegalSerbiaSeychellesSierra LeoneSingaporeSlovak RepublicSloveniaSolomon IslandsSouth AfricaSpainSri LankaSt. Kitts and NevisSt. LuciaSt. Vincent and the GrenadinesSurinameSwazilandSwedenSwitzerlandSyrian Arab RepublicTajikistanTanzaniaThailandTimor-LesteTogoTrinidad and TobagoTunisiaTurkeyUgandaUkraineUnited Arab EmiratesUnited KingdomUnited StatesUruguayVanuatuVenezuela, RBVietnamWest Bank and GazaYemen, Rep.ZambiaZimbabwe

La ligne de temps

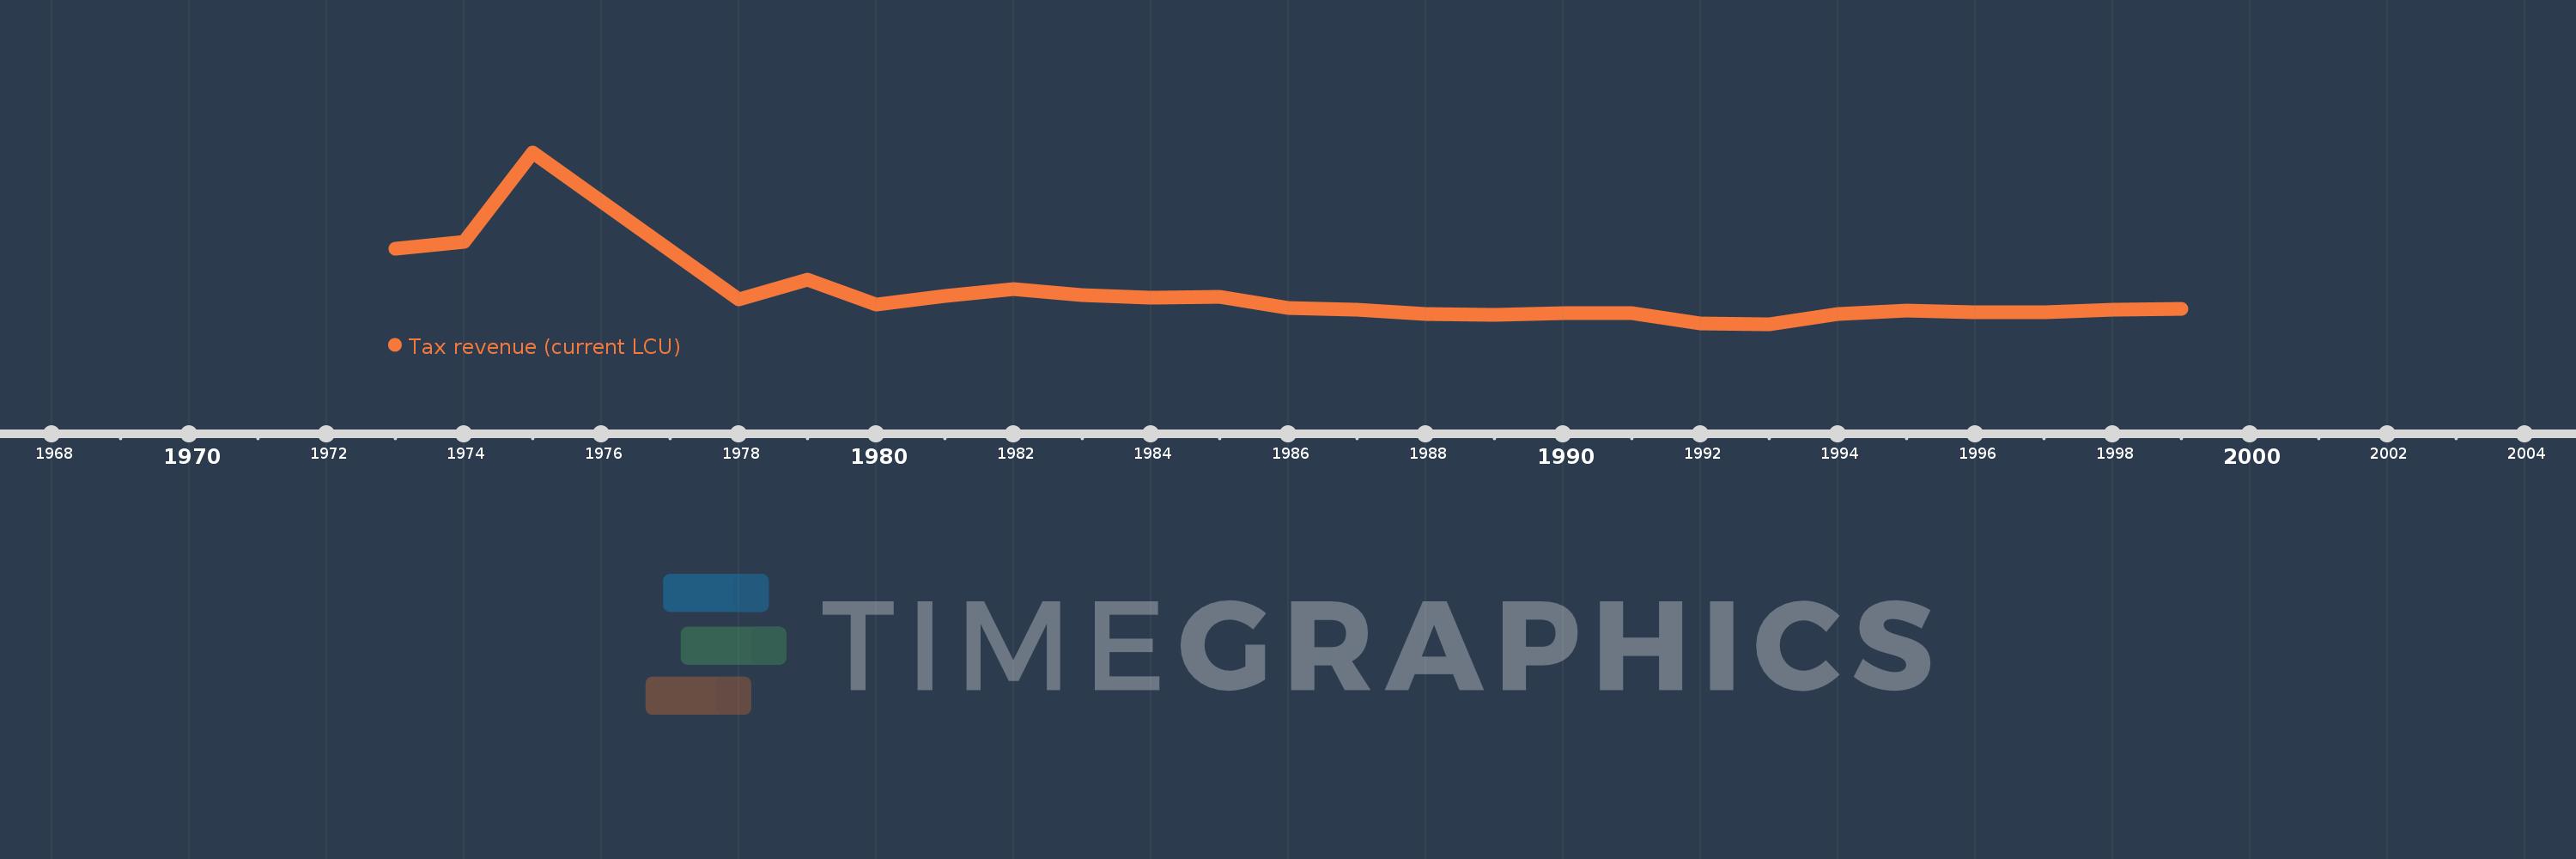
Cette échelle de temps montre un graphique de 1973 année à 1999 année Kuwait. Les données jusqu'à 1972 année ne sont pas présentés. Quantité d'observations actuelles selon dates: 25.

Source (désignation):

Les indicateurs du développement mondiale

Source (organisation):

International Monetary Fund, Government Finance Statistics Yearbook and data files.

Catégories:

Public Sector

Dernière mise à jour

23 avr. 2017

Les indicateurs de changement de valeurs selon les années

En moyenne:
211.6 mln.
Minimum:
5.0 mln.
1 janv. 1993
Maximum:
1.246 mds
1 janv. 1975
Pour la date d''observation
Valeur
Changement absolu
Le changement par rapport à la valeur précédente
1 janv. 1973
548.0 mln.
+548.0 mln.
0.0%
1 janv. 1974
597.0 mln.
+49.0 mln.
8.94%
1 janv. 1975
1.246 mds
+649.0 mln.
108.71%
1 janv. 1978
187.0 mln.
-1.059 mds
-84.99%
1 janv. 1979
324.0 mln.
+137.0 mln.
73.26%
1 janv. 1980
149.0 mln.
-175.0 mln.
-54.01%
1 janv. 1981
209.0 mln.
+60.0 mln.
40.27%
1 janv. 1982
261.0 mln.
+52.0 mln.
24.88%
1 janv. 1983
214.0 mln.
-47.0 mln.
-18.01%
1 janv. 1984
197.0 mln.
-17.0 mln.
-7.94%
1 janv. 1985
201.0 mln.
+4.0 mln.
2.03%
1 janv. 1986
125.0 mln.
-76.0 mln.
-37.81%
1 janv. 1987
109.0 mln.
-16.0 mln.
-12.8%
1 janv. 1988
79.0 mln.
-30.0 mln.
-27.52%
1 janv. 1989
71.0 mln.
-8.0 mln.
-10.13%
1 janv. 1990
84.0 mln.
+13.0 mln.
18.31%
1 janv. 1991
82.0 mln.
-2.0 mln.
-2.38%
1 janv. 1992
8.0 mln.
-74.0 mln.
-90.24%
1 janv. 1993
5.0 mln.
-3.0 mln.
-37.5%
1 janv. 1994
79.0 mln.
+74.0 mln.
1.48 milles%
1 janv. 1995
105.0 mln.
+26.0 mln.
32.91%
1 janv. 1996
93.0 mln.
-12.0 mln.
-11.43%
1 janv. 1997
91.0 mln.
-2.0 mln.
-2.15%
1 janv. 1998
108.0 mln.
+17.0 mln.
18.68%
1 janv. 1999
118.0 mln.
+10.0 mln.
9.26%

Classement des pays selon les statistiques actuelles par années