29
/fr/
fr
AIzaSyAYiBZKx7MnpbEhh9jyipgxe19OcubqV5w
April 1, 2024
250349
St. Kitts and Nevis
KNA
true
2
1
Tax revenue (current LCU)
2015,2014,2013,2012,2011,2010,2009,2008,2007,2006,2005,2004,2003,2002,2001,1995,1994,1993,1992,1991
Download
Bibliothèque de statistiques globales →St. Kitts and Nevis →

Tax revenue (current LCU)

Cette statistique dans les autres pays:
AfghanistanAlbaniaAlgeriaAngolaAntigua and BarbudaArgentinaArmeniaAustraliaAustriaAzerbaijanBahamas, TheBahrainBangladeshBarbadosBelarusBelgiumBelizeBeninBhutanBoliviaBosnia and HerzegovinaBotswanaBrazilBulgariaBurkina FasoBurundiCabo VerdeCambodiaCanadaCentral African RepublicChileChinaColombiaCongo, Dem. Rep.Congo, Rep.Costa RicaCote d'IvoireCroatiaCyprusCzech RepublicDenmarkDominicaDominican RepublicEgypt, Arab Rep.El SalvadorEquatorial GuineaEstoniaEthiopiaFijiFinlandFranceGambia, TheGeorgiaGermanyGhanaGreeceGrenadaGuatemalaHondurasHong Kong SAR, ChinaHungaryIcelandIndiaIndonesiaIran, Islamic Rep.IraqIrelandIsraelItalyJamaicaJapanJordanKazakhstanKenyaKiribatiKorea, Rep.KuwaitKyrgyz RepublicLao PDRLatviaLebanonLesothoLiberiaLithuaniaLuxembourgMacao SAR, ChinaMacedonia, FYRMadagascarMalawiMalaysiaMaldivesMaliMaltaMauritiusMexicoMicronesia, Fed. Sts.MoldovaMongoliaMoroccoMozambiqueMyanmarNamibiaNepalNetherlandsNew ZealandNicaraguaNigeriaNorwayOmanPakistanPanamaPapua New GuineaParaguayPeruPhilippinesPolandPortugalQatarRomaniaRussian FederationRwandaSamoaSan MarinoSao Tome and PrincipeSenegalSerbiaSeychellesSierra LeoneSingaporeSlovak RepublicSloveniaSolomon IslandsSouth AfricaSpainSri LankaSt. Kitts and NevisSt. LuciaSt. Vincent and the GrenadinesSurinameSwazilandSwedenSwitzerlandSyrian Arab RepublicTajikistanTanzaniaThailandTimor-LesteTogoTrinidad and TobagoTunisiaTurkeyUgandaUkraineUnited Arab EmiratesUnited KingdomUnited StatesUruguayVanuatuVenezuela, RBVietnamWest Bank and GazaYemen, Rep.ZambiaZimbabwe
La ligne de temps
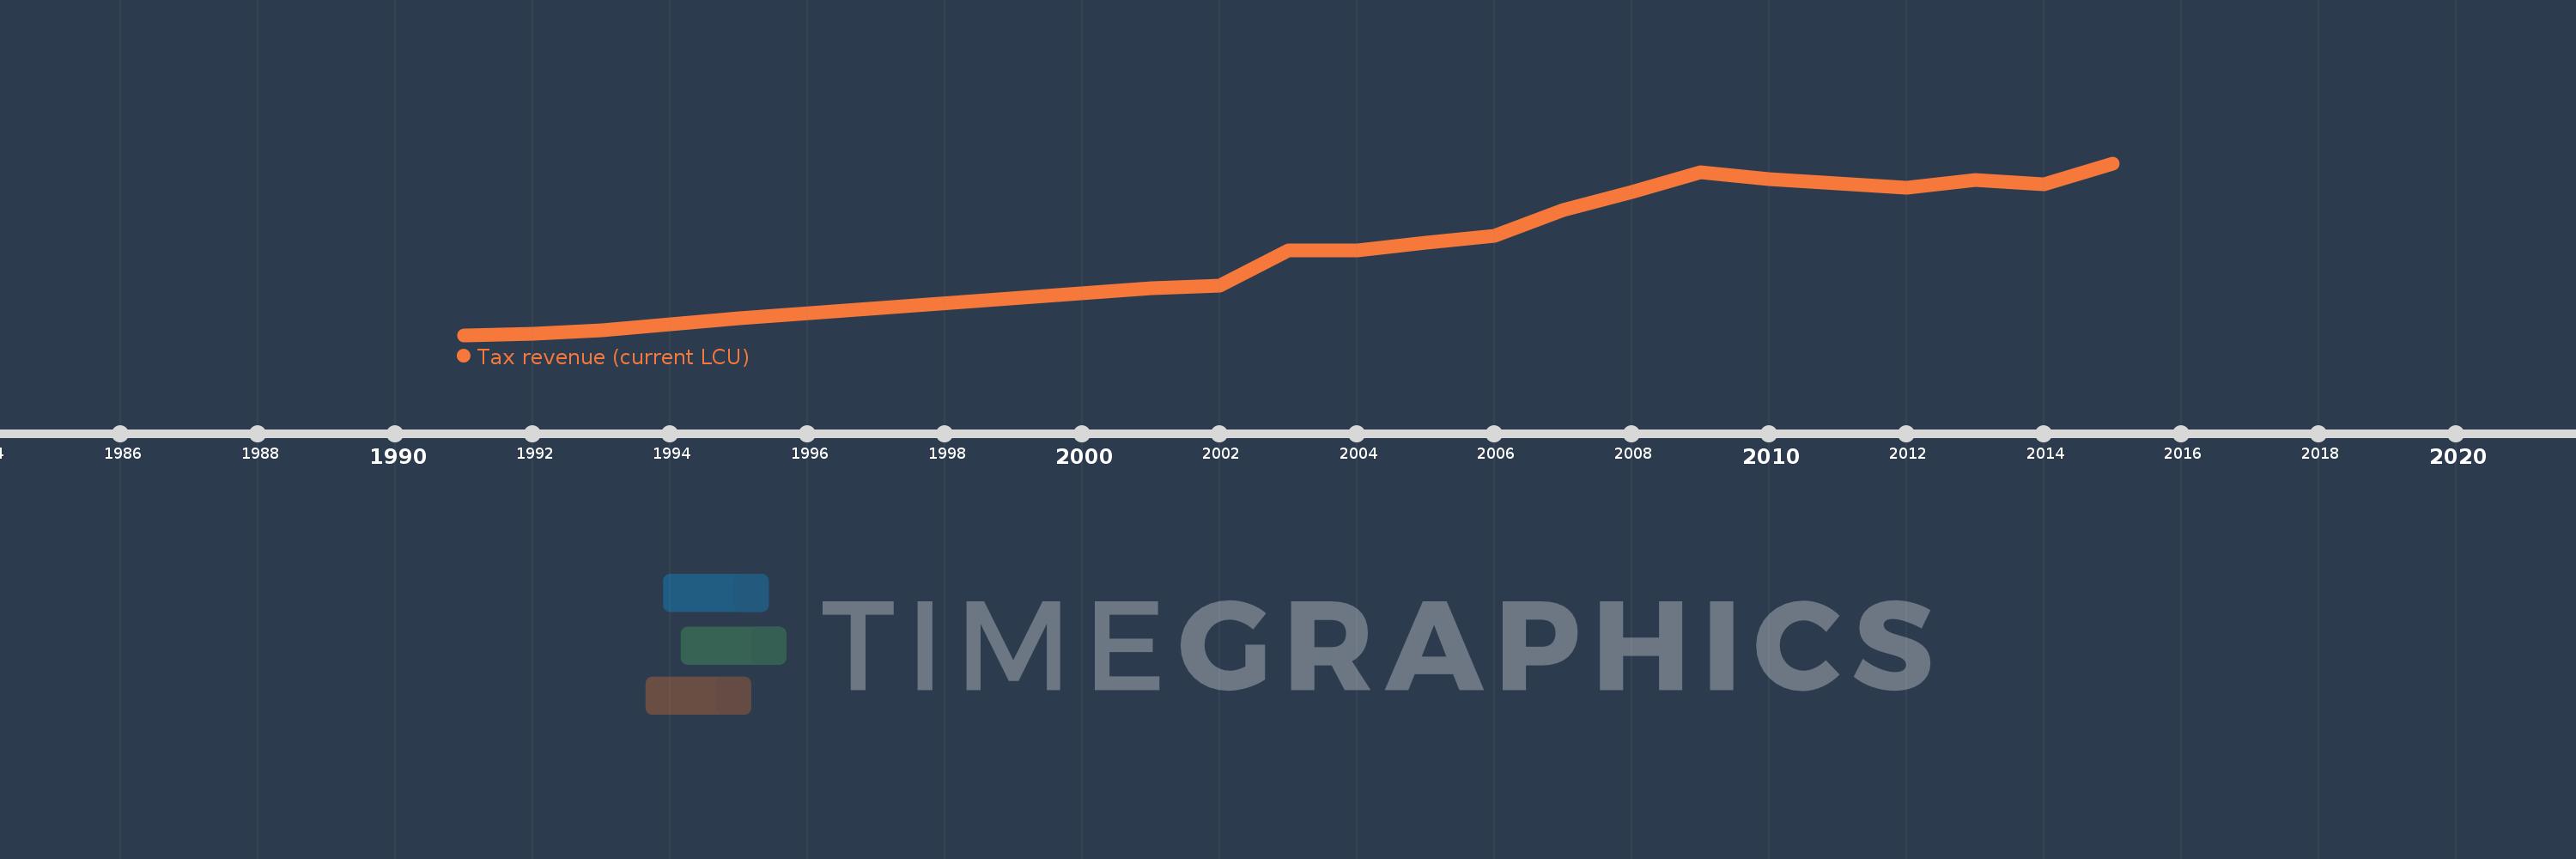
Cette échelle de temps montre un graphique de 1991 année à 2015 année St. Kitts and Nevis. Les données jusqu'à 1990 année ne sont pas présentés. Quantité d'observations actuelles selon dates: 20.
Source (désignation):
Les indicateurs du développement mondiale
Source (organisation):
International Monetary Fund, Government Finance Statistics Yearbook and data files.
Catégories:
Public Sector
Dernière mise à jour
23 avr. 2017
Les indicateurs de changement de valeurs selon les années
En moyenne:
290.9 mln.
Minimum:
84.39 mln.
1 janv. 1991
Maximum:
467.212 mln.
1 janv. 2015
Pour la date d''observation
Valeur
Changement absolu
Le changement par rapport à la valeur précédente
1 janv. 1991
84.39 mln.
+84.39 mln.
0.0%
1 janv. 1992
86.85 mln.
+2.46 mln.
2.92%
1 janv. 1993
94.95 mln.
+8.1 mln.
9.33%
1 janv. 1994
108.23 mln.
+13.28 mln.
13.99%
1 janv. 1995
121.5 mln.
+13.27 mln.
12.26%
1 janv. 2001
188.0 mln.
+66.5 mln.
54.73%
1 janv. 2002
194.6 mln.
+6.6 mln.
3.51%
1 janv. 2003
272.823 mln.
+78.223 mln.
40.2%
1 janv. 2004
272.537 mln.
-286.0 milles
-0.1%
1 janv. 2005
290.899 mln.
+18.362 mln.
6.74%
1 janv. 2006
305.268 mln.
+14.369 mln.
4.94%
1 janv. 2007
362.774 mln.
+57.506 mln.
18.84%
1 janv. 2008
402.589 mln.
+39.815 mln.
10.98%
1 janv. 2009
447.954 mln.
+45.365 mln.
11.27%
1 janv. 2010
432.608 mln.
-15.346 mln.
-3.43%
1 janv. 2011
421.474 mln.
-11.135 mln.
-2.57%
1 janv. 2012
412.138 mln.
-9.335 mln.
-2.21%
1 janv. 2013
430.578 mln.
+18.44 mln.
4.47%
1 janv. 2014
420.634 mln.
-9.944 mln.
-2.31%
1 janv. 2015
467.212 mln.
+46.578 mln.
11.07%
Classement des pays selon les statistiques actuelles par années

Commentaires:

Envoyer
PremiumAbout & FeedbackUn accordConfidentialité
logo
© 2022 Selected Technologies LLC – Morgan Hill, California