33
/fr/
AIzaSyAYiBZKx7MnpbEhh9jyipgxe19OcubqV5w
August 1, 2025
77667
Bahrain
BHR
true
2
1
Tax revenue (current LCU)
2014,2012,2011,2010,2009,2008,2007,2006,2005,2004,2003,2002,2001,2000,1999,1998,1997,1996,1995,1994,1993,1992,1991
Download
Bibliothèque de statistiques globales →Bahrain →

Tax revenue (current LCU)

Cette statistique dans les autres pays:

AfghanistanAlbaniaAlgeriaAngolaAntigua and BarbudaArgentinaArmeniaAustraliaAustriaAzerbaijanBahamas, TheBahrainBangladeshBarbadosBelarusBelgiumBelizeBeninBhutanBoliviaBosnia and HerzegovinaBotswanaBrazilBulgariaBurkina FasoBurundiCabo VerdeCambodiaCanadaCentral African RepublicChileChinaColombiaCongo, Dem. Rep.Congo, Rep.Costa RicaCote d'IvoireCroatiaCyprusCzech RepublicDenmarkDominicaDominican RepublicEgypt, Arab Rep.El SalvadorEquatorial GuineaEstoniaEthiopiaFijiFinlandFranceGambia, TheGeorgiaGermanyGhanaGreeceGrenadaGuatemalaHondurasHong Kong SAR, ChinaHungaryIcelandIndiaIndonesiaIran, Islamic Rep.IraqIrelandIsraelItalyJamaicaJapanJordanKazakhstanKenyaKiribatiKorea, Rep.KuwaitKyrgyz RepublicLao PDRLatviaLebanonLesothoLiberiaLithuaniaLuxembourgMacao SAR, ChinaMacedonia, FYRMadagascarMalawiMalaysiaMaldivesMaliMaltaMauritiusMexicoMicronesia, Fed. Sts.MoldovaMongoliaMoroccoMozambiqueMyanmarNamibiaNepalNetherlandsNew ZealandNicaraguaNigeriaNorwayOmanPakistanPanamaPapua New GuineaParaguayPeruPhilippinesPolandPortugalQatarRomaniaRussian FederationRwandaSamoaSan MarinoSao Tome and PrincipeSenegalSerbiaSeychellesSierra LeoneSingaporeSlovak RepublicSloveniaSolomon IslandsSouth AfricaSpainSri LankaSt. Kitts and NevisSt. LuciaSt. Vincent and the GrenadinesSurinameSwazilandSwedenSwitzerlandSyrian Arab RepublicTajikistanTanzaniaThailandTimor-LesteTogoTrinidad and TobagoTunisiaTurkeyUgandaUkraineUnited Arab EmiratesUnited KingdomUnited StatesUruguayVanuatuVenezuela, RBVietnamWest Bank and GazaYemen, Rep.ZambiaZimbabwe

La ligne de temps

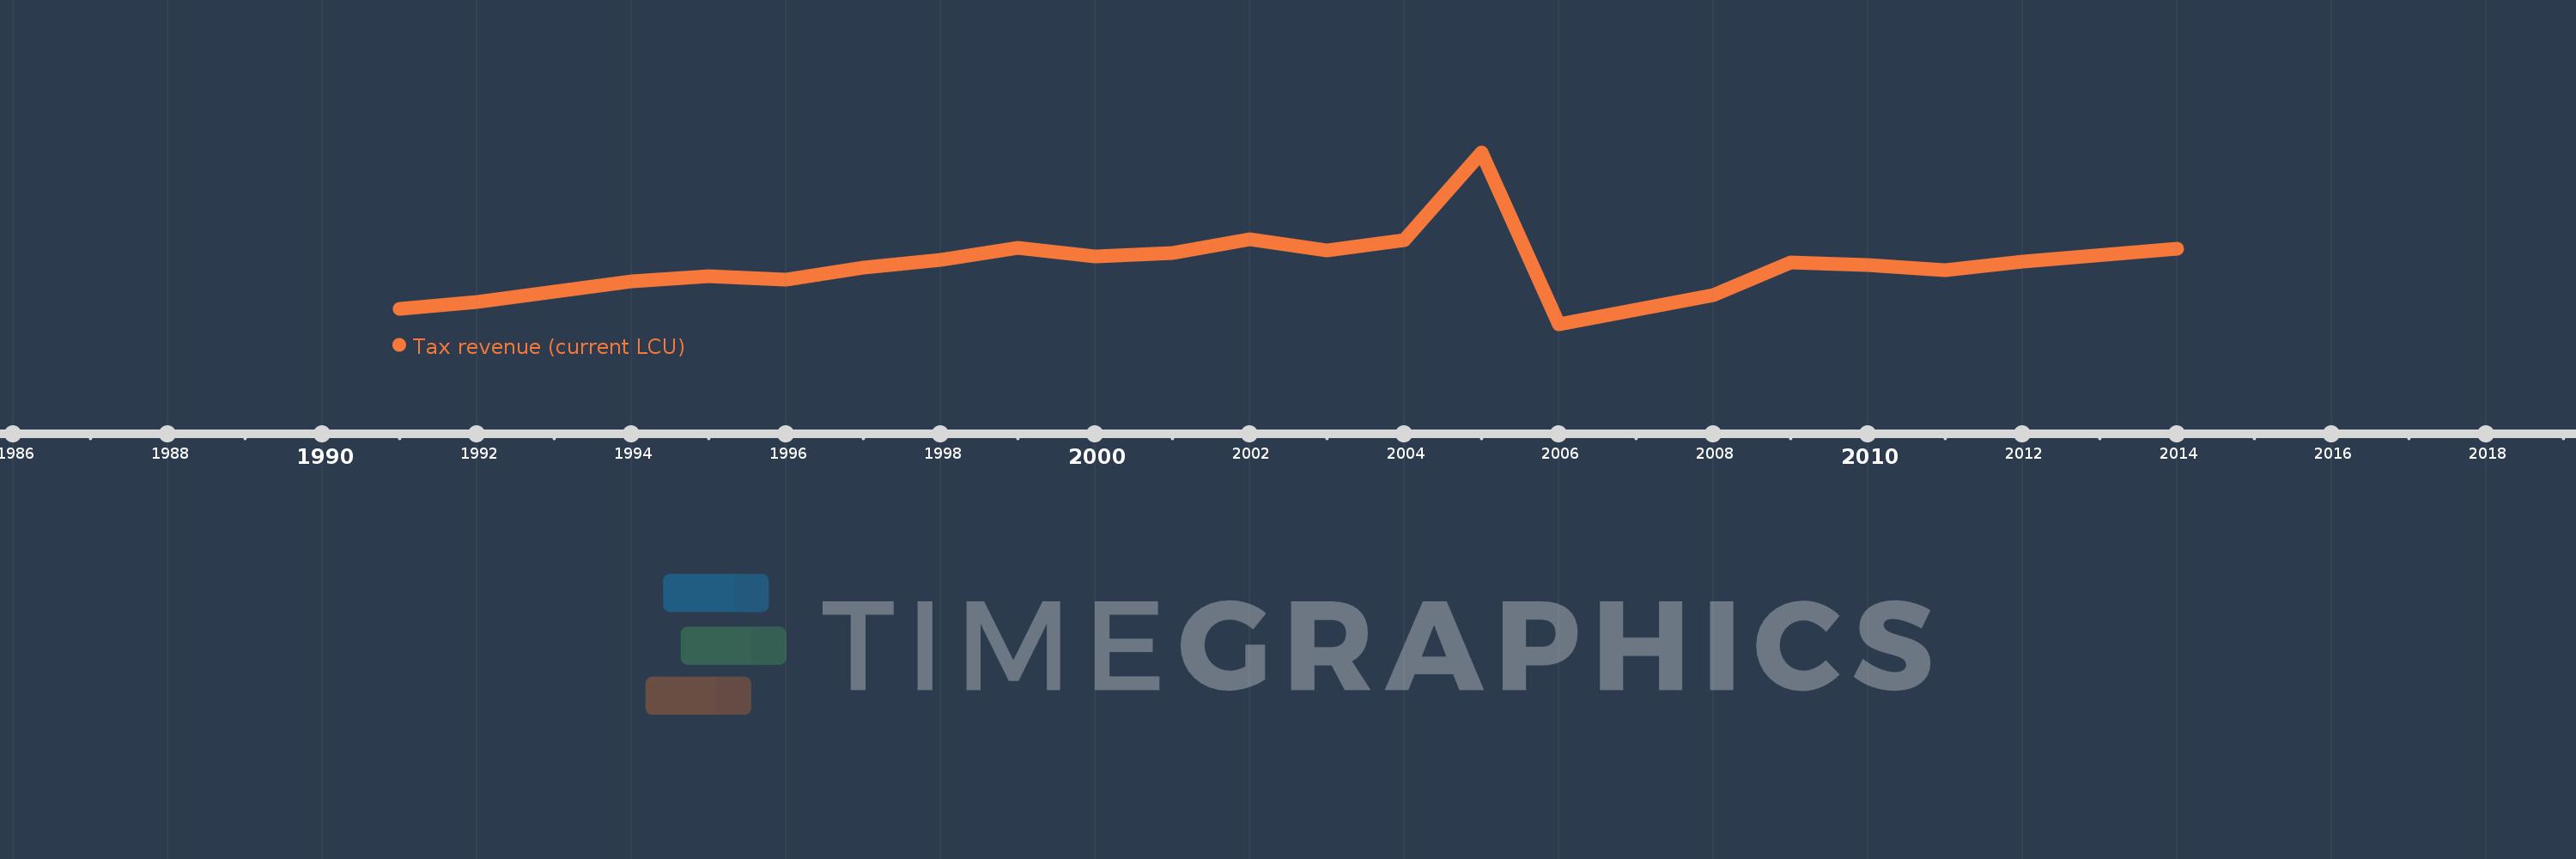
Cette échelle de temps montre un graphique de 1991 année à 2014 année Bahrain. Les données jusqu'à 1990 année ne sont pas présentés. Quantité d'observations actuelles selon dates: 23.

Source (désignation):

Les indicateurs du développement mondiale

Source (organisation):

International Monetary Fund, Government Finance Statistics Yearbook and data files.

Catégories:

Public Sector

Dernière mise à jour

23 avr. 2017

Les indicateurs de changement de valeurs selon les années

En moyenne:
115.925 mln.
Minimum:
69.76 mln.
1 janv. 2006
Maximum:
208.5 mln.
1 janv. 2005
Pour la date d''observation
Valeur
Changement absolu
Le changement par rapport à la valeur précédente
1 janv. 1991
82.5 mln.
+82.5 mln.
0.0%
1 janv. 1992
87.5 mln.
+5.0 mln.
6.06%
1 janv. 1993
96.3 mln.
+8.8 mln.
10.06%
1 janv. 1994
104.6 mln.
+8.3 mln.
8.62%
1 janv. 1995
108.3 mln.
+3.7 mln.
3.54%
1 janv. 1996
105.5 mln.
-2.8 mln.
-2.59%
1 janv. 1997
115.7 mln.
+10.2 mln.
9.67%
1 janv. 1998
121.7 mln.
+6.0 mln.
5.19%
1 janv. 1999
131.7 mln.
+10.0 mln.
8.22%
1 janv. 2000
124.8 mln.
-6.9 mln.
-5.24%
1 janv. 2001
127.2 mln.
+2.4 mln.
1.92%
1 janv. 2002
138.5 mln.
+11.3 mln.
8.88%
1 janv. 2003
129.1 mln.
-9.4 mln.
-6.79%
1 janv. 2004
137.7 mln.
+8.6 mln.
6.66%
1 janv. 2005
208.5 mln.
+70.8 mln.
51.42%
1 janv. 2006
69.76 mln.
-138.74 mln.
-66.54%
1 janv. 2007
81.14 mln.
+11.38 mln.
16.31%
1 janv. 2008
93.56 mln.
+12.42 mln.
15.31%
1 janv. 2009
119.47 mln.
+25.91 mln.
27.69%
1 janv. 2010
117.57 mln.
-1.9 mln.
-1.59%
1 janv. 2011
113.72 mln.
-3.85 mln.
-3.27%
1 janv. 2012
120.551 mln.
+6.831 mln.
6.01%
1 janv. 2014
130.9 mln.
+10.349 mln.
8.58%

Classement des pays selon les statistiques actuelles par années