29
/fr/
fr
AIzaSyAYiBZKx7MnpbEhh9jyipgxe19OcubqV5w
April 1, 2024
138811
Georgia
GEO
true
2
1
Tax revenue (current LCU)
2016,2015,2014,2013,2012,2011,2010,2009,2008,2007,2006,2005,2004,2003,2002,2001,2000,1999,1998
Download
Bibliothèque de statistiques globales →Georgia →

Tax revenue (current LCU)

Cette statistique dans les autres pays:
AfghanistanAlbaniaAlgeriaAngolaAntigua and BarbudaArgentinaArmeniaAustraliaAustriaAzerbaijanBahamas, TheBahrainBangladeshBarbadosBelarusBelgiumBelizeBeninBhutanBoliviaBosnia and HerzegovinaBotswanaBrazilBulgariaBurkina FasoBurundiCabo VerdeCambodiaCanadaCentral African RepublicChileChinaColombiaCongo, Dem. Rep.Congo, Rep.Costa RicaCote d'IvoireCroatiaCyprusCzech RepublicDenmarkDominicaDominican RepublicEgypt, Arab Rep.El SalvadorEquatorial GuineaEstoniaEthiopiaFijiFinlandFranceGambia, TheGeorgiaGermanyGhanaGreeceGrenadaGuatemalaHondurasHong Kong SAR, ChinaHungaryIcelandIndiaIndonesiaIran, Islamic Rep.IraqIrelandIsraelItalyJamaicaJapanJordanKazakhstanKenyaKiribatiKorea, Rep.KuwaitKyrgyz RepublicLao PDRLatviaLebanonLesothoLiberiaLithuaniaLuxembourgMacao SAR, ChinaMacedonia, FYRMadagascarMalawiMalaysiaMaldivesMaliMaltaMauritiusMexicoMicronesia, Fed. Sts.MoldovaMongoliaMoroccoMozambiqueMyanmarNamibiaNepalNetherlandsNew ZealandNicaraguaNigeriaNorwayOmanPakistanPanamaPapua New GuineaParaguayPeruPhilippinesPolandPortugalQatarRomaniaRussian FederationRwandaSamoaSan MarinoSao Tome and PrincipeSenegalSerbiaSeychellesSierra LeoneSingaporeSlovak RepublicSloveniaSolomon IslandsSouth AfricaSpainSri LankaSt. Kitts and NevisSt. LuciaSt. Vincent and the GrenadinesSurinameSwazilandSwedenSwitzerlandSyrian Arab RepublicTajikistanTanzaniaThailandTimor-LesteTogoTrinidad and TobagoTunisiaTurkeyUgandaUkraineUnited Arab EmiratesUnited KingdomUnited StatesUruguayVanuatuVenezuela, RBVietnamWest Bank and GazaYemen, Rep.ZambiaZimbabwe
La ligne de temps
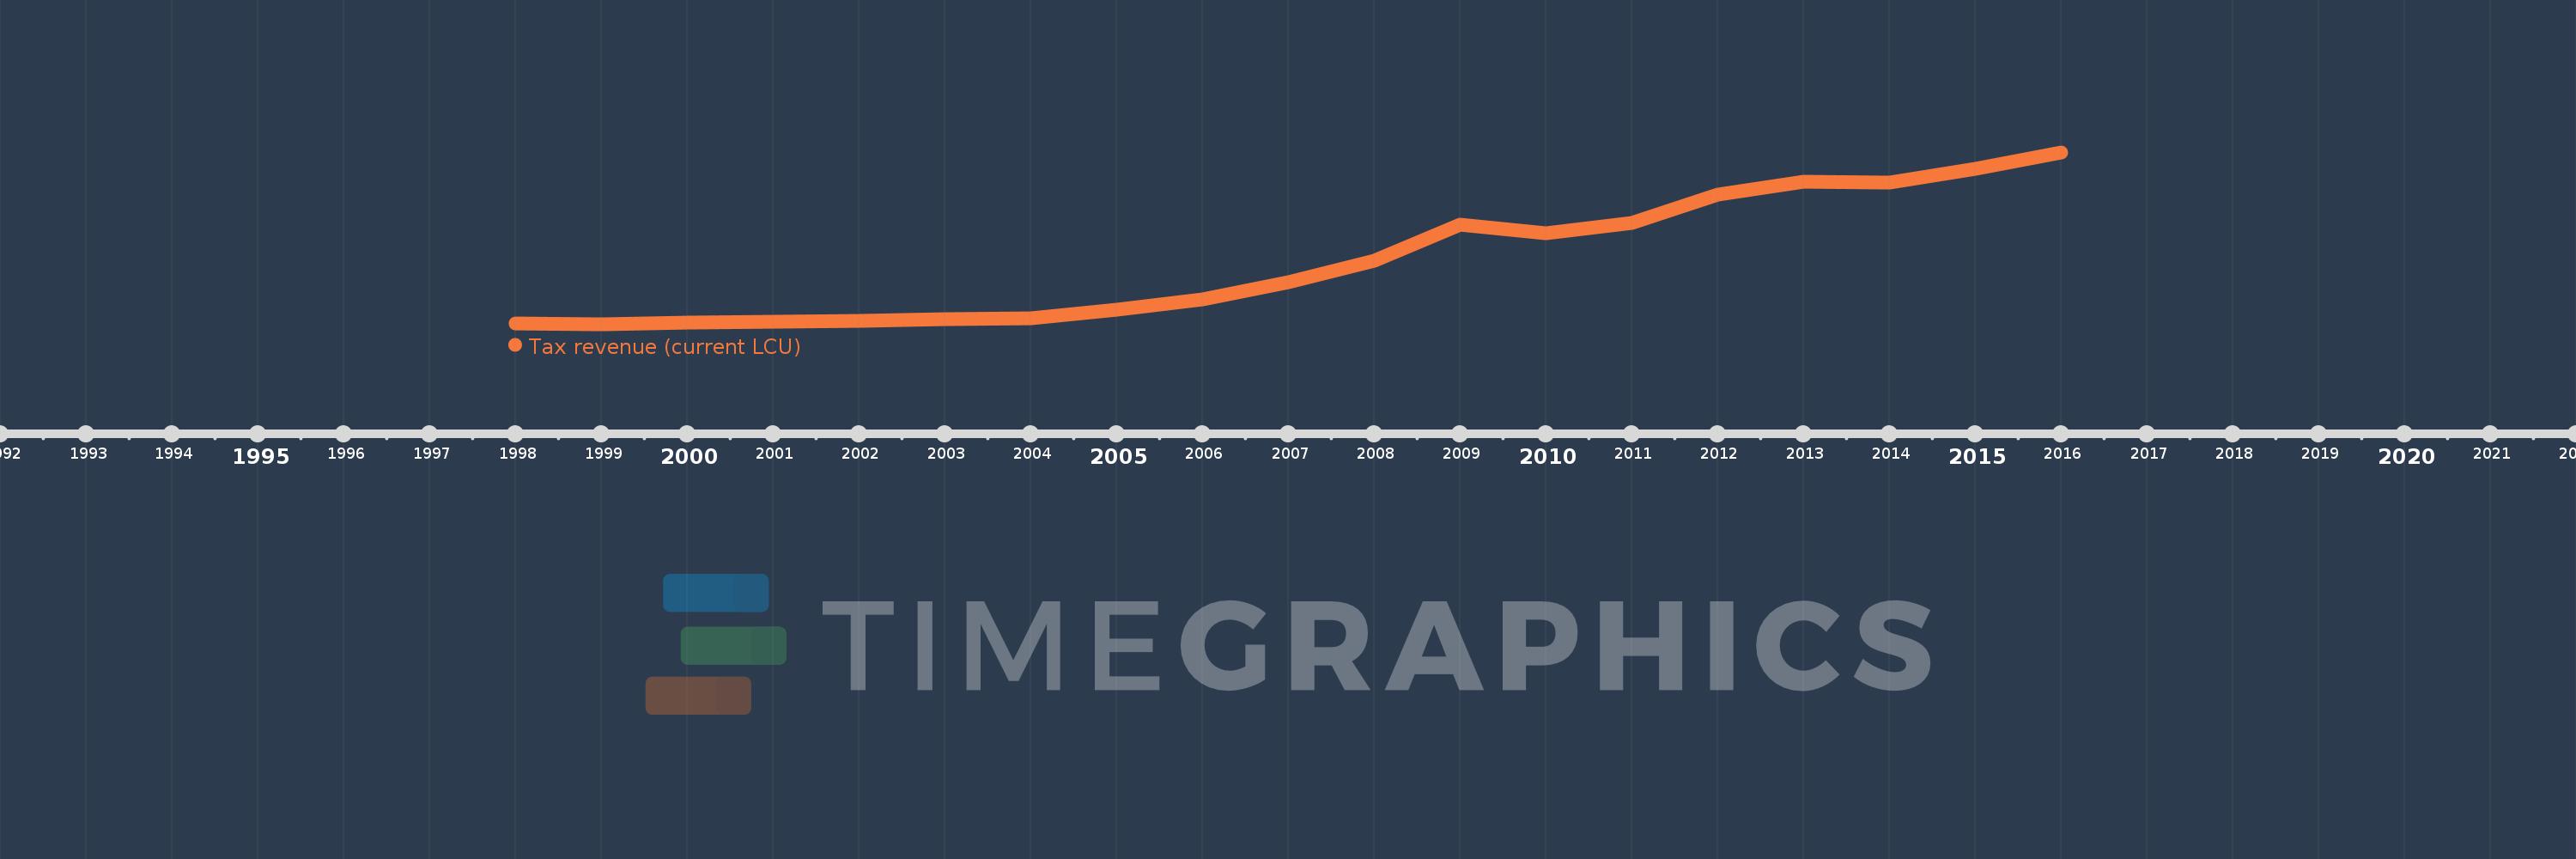
Cette échelle de temps montre un graphique de 1998 année à 2016 année Georgia. Les données jusqu'à 1997 année ne sont pas présentés. Quantité d'observations actuelles selon dates: 19.
Source (désignation):
Les indicateurs du développement mondiale
Source (organisation):
International Monetary Fund, Government Finance Statistics Yearbook and data files.
Catégories:
Public Sector
Dernière mise à jour
23 avr. 2017
Les indicateurs de changement de valeurs selon les années
En moyenne:
2.996 mds
Minimum:
363.7 mln.
1 janv. 1999
Maximum:
7.55 mds
1 janv. 2016
Pour la date d''observation
Valeur
Changement absolu
Le changement par rapport à la valeur précédente
1 janv. 1998
379.6 mln.
+379.6 mln.
0.0%
1 janv. 1999
363.7 mln.
-15.9 mln.
-4.19%
1 janv. 2000
448.0 mln.
+84.3 mln.
23.18%
1 janv. 2001
462.4 mln.
+14.4 mln.
3.21%
1 janv. 2002
490.7 mln.
+28.3 mln.
6.12%
1 janv. 2003
567.9 mln.
+77.2 mln.
15.73%
1 janv. 2004
602.3 mln.
+34.4 mln.
6.06%
1 janv. 2005
975.3 mln.
+373.0 mln.
61.93%
1 janv. 2006
1.407 mds
+432.0 mln.
44.29%
1 janv. 2007
2.13 mds
+723.0 mln.
51.37%
1 janv. 2008
3.01 mds
+880.2 mln.
41.32%
1 janv. 2009
4.542 mds
+1.531 mds
50.86%
1 janv. 2010
4.162 mds
-379.9 mln.
-8.36%
1 janv. 2011
4.592 mds
+430.7 mln.
10.35%
1 janv. 2012
5.802 mds
+1.21 mds
26.34%
1 janv. 2013
6.311 mds
+509.1 mln.
8.77%
1 janv. 2014
6.288 mds
-23.4 mln.
-0.37%
1 janv. 2015
6.847 mds
+559.3 mln.
8.9%
1 janv. 2016
7.55 mds
+702.6 mln.
10.26%
Classement des pays selon les statistiques actuelles par années

Commentaires:

Envoyer
PremiumAbout & FeedbackUn accordConfidentialité
logo
© 2022 Selected Technologies LLC – Morgan Hill, California