33
/fr/
AIzaSyAYiBZKx7MnpbEhh9jyipgxe19OcubqV5w
August 1, 2025
80907
Belarus
BLR
true
2
1
Net financial flows, IBRD (NFL, current US$)
2016,2015,2014,2013,2012,2011,2010,2009,2008,2007,2006,2005,2004,2003,2002,2001,2000,1999,1998,1997,1996,1995,1994
Download
Bibliothèque de statistiques globales →Belarus →

Net financial flows, IBRD (NFL, current US$)

Cette statistique dans les autres pays:

AlbaniaAlgeriaAngolaArgentinaArmeniaAzerbaijanBangladeshBelarusBelizeBoliviaBosnia and HerzegovinaBotswanaBrazilBulgariaBurundiCabo VerdeCameroonCaribbean small statesCentral Europe and the BalticsChadChinaColombiaCongo, Dem. Rep.Congo, Rep.Costa RicaCote d'IvoireCroatiaCzech RepublicDominicaDominican RepublicEarly-demographic dividendEast Asia & PacificEast Asia & Pacific (excluding high income)East Asia & Pacific (IDA & IBRD countries)EcuadorEgypt, Arab Rep.El SalvadorEquatorial GuineaEstoniaEthiopiaEurope & Central AsiaEurope & Central Asia (excluding high income)Europe & Central Asia (IDA & IBRD countries)FijiFragile and conflict affected situationsGabonGeorgiaGhanaGreeceGrenadaGuatemalaGuineaGuyanaHondurasHungaryIBRD onlyIDA & IBRD totalIDA blendIDA onlyIDA totalIndiaIndonesiaIran, Islamic Rep.JamaicaJordanKazakhstanKenyaKorea, Rep.KosovoLate-demographic dividendLatin America & Caribbean Latin America & Caribbean (excluding high income)Latin America & the Caribbean (IDA & IBRD countries)LebanonLesothoLiberiaLow & middle incomeLow incomeLower middle incomeMacedonia, FYRMadagascarMalawiMalaysiaMauritaniaMauritiusMexicoMiddle East & North AfricaMiddle East & North Africa (excluding high income)Middle East & North Africa (IDA & IBRD countries)Middle incomeMoldovaMontenegroMoroccoMyanmarNicaraguaNigeriaOmanOther small statesPacific island small statesPakistanPanamaPapua New GuineaParaguayPeruPhilippinesPolandPre-demographic dividendRomaniaRussian FederationSenegalSerbiaSeychellesSierra LeoneSlovak RepublicSloveniaSmall statesSouth AfricaSouth AsiaSouth Asia (IDA & IBRD)Sri LankaSt. Kitts and NevisSt. LuciaSt. Vincent and the GrenadinesSub-Saharan Africa Sub-Saharan Africa (excluding high income)Sub-Saharan Africa (IDA & IBRD countries)SudanSwazilandSyrian Arab RepublicTanzaniaThailandTogoTrinidad and TobagoTunisiaTurkeyTurkmenistanUgandaUkraineUpper middle incomeUzbekistanVenezuela, RBVietnamZambiaZimbabwe

La ligne de temps

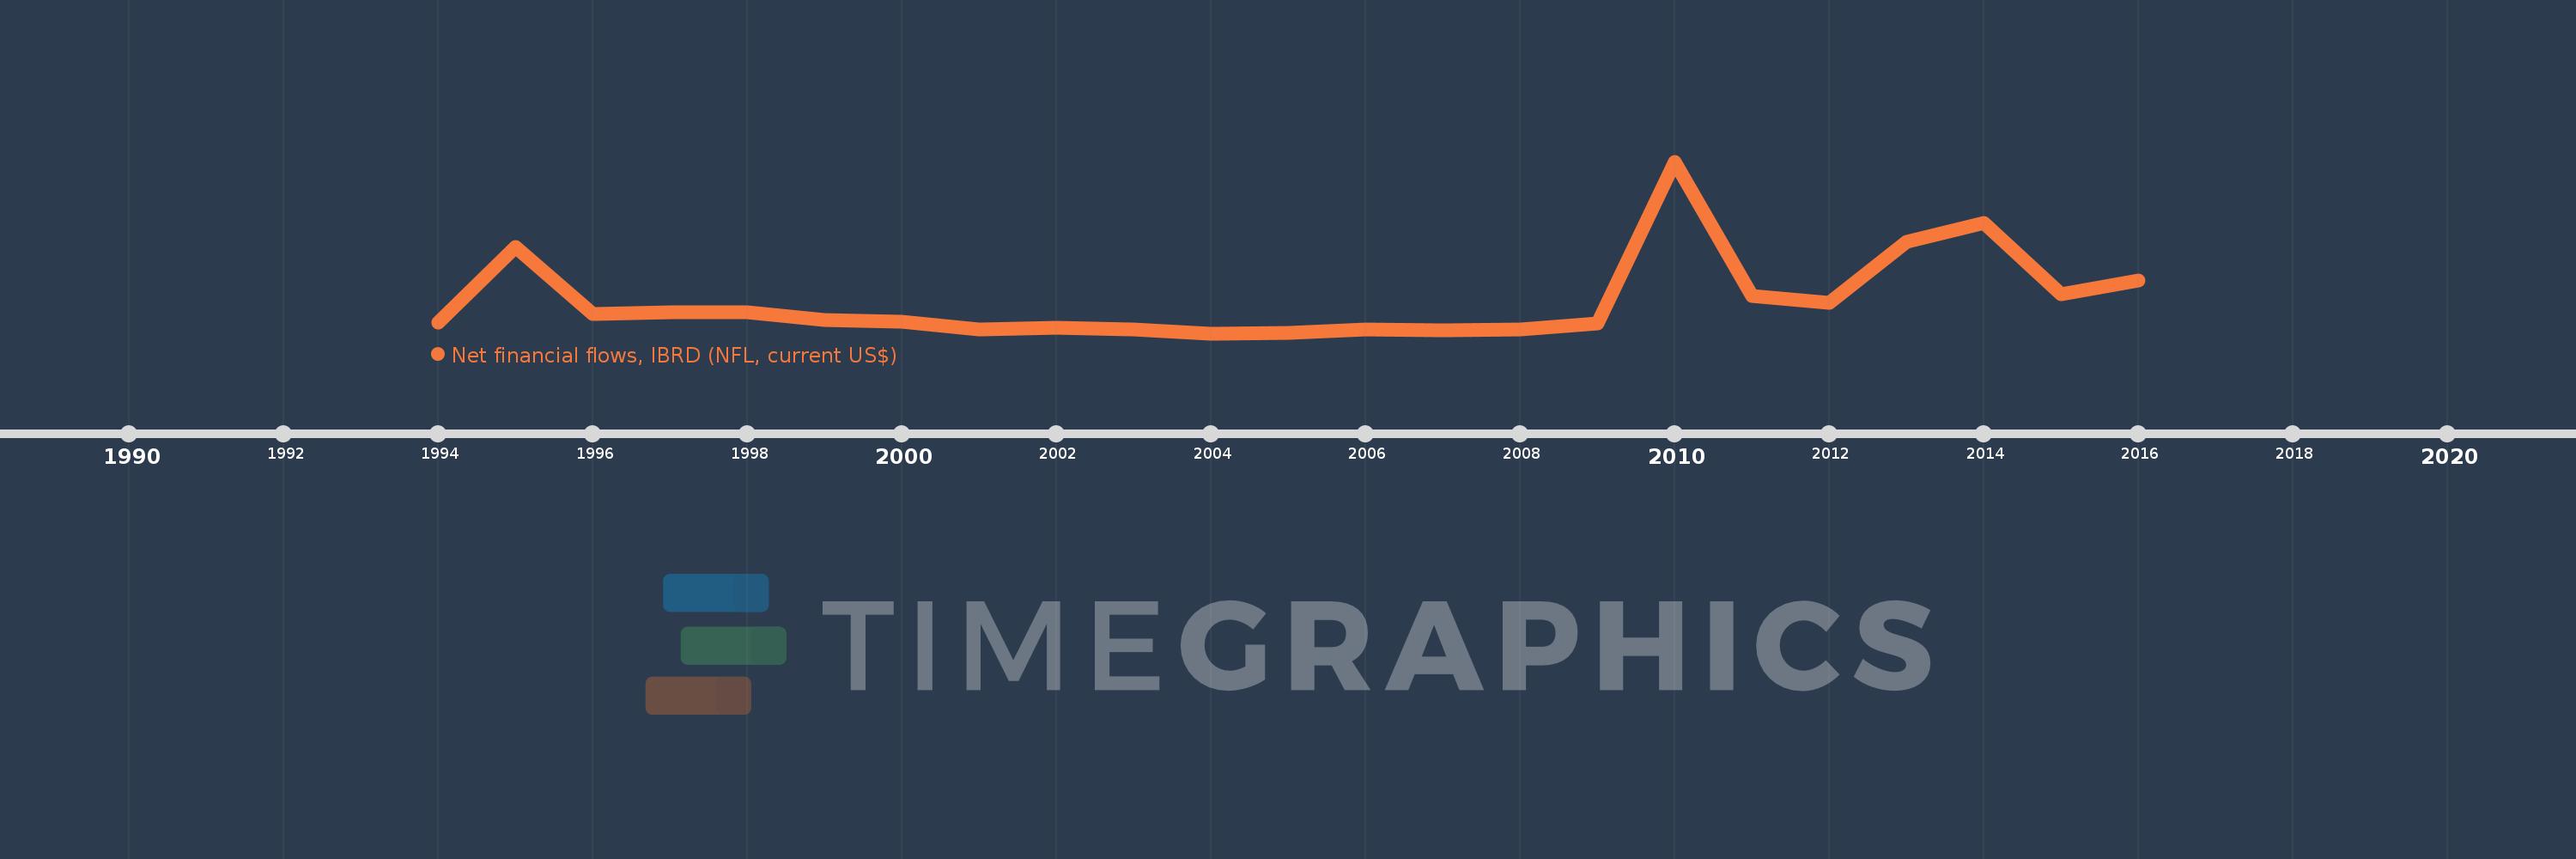
Cette échelle de temps montre un graphique de 1994 année à 2016 année Belarus. Les données jusqu'à 1993 année ne sont pas présentés. Quantité d'observations actuelles selon dates: 23.

Source (désignation):

Les indicateurs du développement mondiale

Source (organisation):

World Bank, International Debt Statistics.

Catégories:

External Debt

Dernière mise à jour

23 avr. 2017

Les indicateurs de changement de valeurs selon les années

En moyenne:
29.091 mln.
Minimum:
-14.348 mln.
1 janv. 2004
Maximum:
213.481 mln.
1 janv. 2010
Pour la date d''observation
Valeur
Changement absolu
Le changement par rapport à la valeur précédente
1 janv. 1994
100.0 milles
+100.0 milles
0.0%
1 janv. 1995
100.142 mln.
+100.042 mln.
100.04 milles%
1 janv. 1996
11.228 mln.
-88.914 mln.
-88.79%
1 janv. 1997
13.881 mln.
+2.653 mln.
23.63%
1 janv. 1998
13.343 mln.
-538.0 milles
-3.88%
1 janv. 1999
3.567 mln.
-9.776 mln.
-73.27%
1 janv. 2000
1.267 mln.
-2.3 mln.
-64.48%
1 janv. 2001
-8.754 mln.
-10.021 mln.
-790.92%
1 janv. 2002
-7.325 mln.
+1.429 mln.
-16.32%
1 janv. 2003
-9.788 mln.
-2.463 mln.
33.62%
1 janv. 2004
-14.348 mln.
-4.56 mln.
46.59%
1 janv. 2005
-13.512 mln.
+836.0 milles
-5.83%
1 janv. 2006
-8.925 mln.
+4.587 mln.
-33.95%
1 janv. 2007
-10.284 mln.
-1.359 mln.
15.23%
1 janv. 2008
-8.669 mln.
+1.615 mln.
-15.7%
1 janv. 2009
-866.0 milles
+7.803 mln.
-90.01%
1 janv. 2010
213.481 mln.
+214.347 mln.
-24.75 milles%
1 janv. 2011
35.705 mln.
-177.776 mln.
-83.27%
1 janv. 2012
26.212 mln.
-9.493 mln.
-26.59%
1 janv. 2013
106.78 mln.
+80.568 mln.
307.37%
1 janv. 2014
132.329 mln.
+25.549 mln.
23.93%
1 janv. 2015
37.261 mln.
-95.068 mln.
-71.84%
1 janv. 2016
56.261 mln.
+19.0 mln.
50.99%

Classement des pays selon les statistiques actuelles par années