29
/fr/
fr
AIzaSyAYiBZKx7MnpbEhh9jyipgxe19OcubqV5w
April 1, 2024
179201
Liberia
LBR
true
2
1
Net financial flows, IBRD (NFL, current US$)
2008,2003,1989,1988,1987,1986,1985,1984,1983,1982,1981,1980,1979,1978,1977,1976,1975,1974,1973,1972,1971
Download
Bibliothèque de statistiques globales →Liberia →

Net financial flows, IBRD (NFL, current US$)

Cette statistique dans les autres pays:
AlbaniaAlgeriaAngolaArgentinaArmeniaAzerbaijanBangladeshBelarusBelizeBoliviaBosnia and HerzegovinaBotswanaBrazilBulgariaBurundiCabo VerdeCameroonCaribbean small statesCentral Europe and the BalticsChadChinaColombiaCongo, Dem. Rep.Congo, Rep.Costa RicaCote d'IvoireCroatiaCzech RepublicDominicaDominican RepublicEarly-demographic dividendEast Asia & PacificEast Asia & Pacific (excluding high income)East Asia & Pacific (IDA & IBRD countries)EcuadorEgypt, Arab Rep.El SalvadorEquatorial GuineaEstoniaEthiopiaEurope & Central AsiaEurope & Central Asia (excluding high income)Europe & Central Asia (IDA & IBRD countries)FijiFragile and conflict affected situationsGabonGeorgiaGhanaGreeceGrenadaGuatemalaGuineaGuyanaHondurasHungaryIBRD onlyIDA & IBRD totalIDA blendIDA onlyIDA totalIndiaIndonesiaIran, Islamic Rep.JamaicaJordanKazakhstanKenyaKorea, Rep.KosovoLate-demographic dividendLatin America & Caribbean Latin America & Caribbean (excluding high income)Latin America & the Caribbean (IDA & IBRD countries)LebanonLesothoLiberiaLow & middle incomeLow incomeLower middle incomeMacedonia, FYRMadagascarMalawiMalaysiaMauritaniaMauritiusMexicoMiddle East & North AfricaMiddle East & North Africa (excluding high income)Middle East & North Africa (IDA & IBRD countries)Middle incomeMoldovaMontenegroMoroccoMyanmarNicaraguaNigeriaOmanOther small statesPacific island small statesPakistanPanamaPapua New GuineaParaguayPeruPhilippinesPolandPre-demographic dividendRomaniaRussian FederationSenegalSerbiaSeychellesSierra LeoneSlovak RepublicSloveniaSmall statesSouth AfricaSouth AsiaSouth Asia (IDA & IBRD)Sri LankaSt. Kitts and NevisSt. LuciaSt. Vincent and the GrenadinesSub-Saharan Africa Sub-Saharan Africa (excluding high income)Sub-Saharan Africa (IDA & IBRD countries)SudanSwazilandSyrian Arab RepublicTanzaniaThailandTogoTrinidad and TobagoTunisiaTurkeyTurkmenistanUgandaUkraineUpper middle incomeUzbekistanVenezuela, RBVietnamZambiaZimbabwe
La ligne de temps
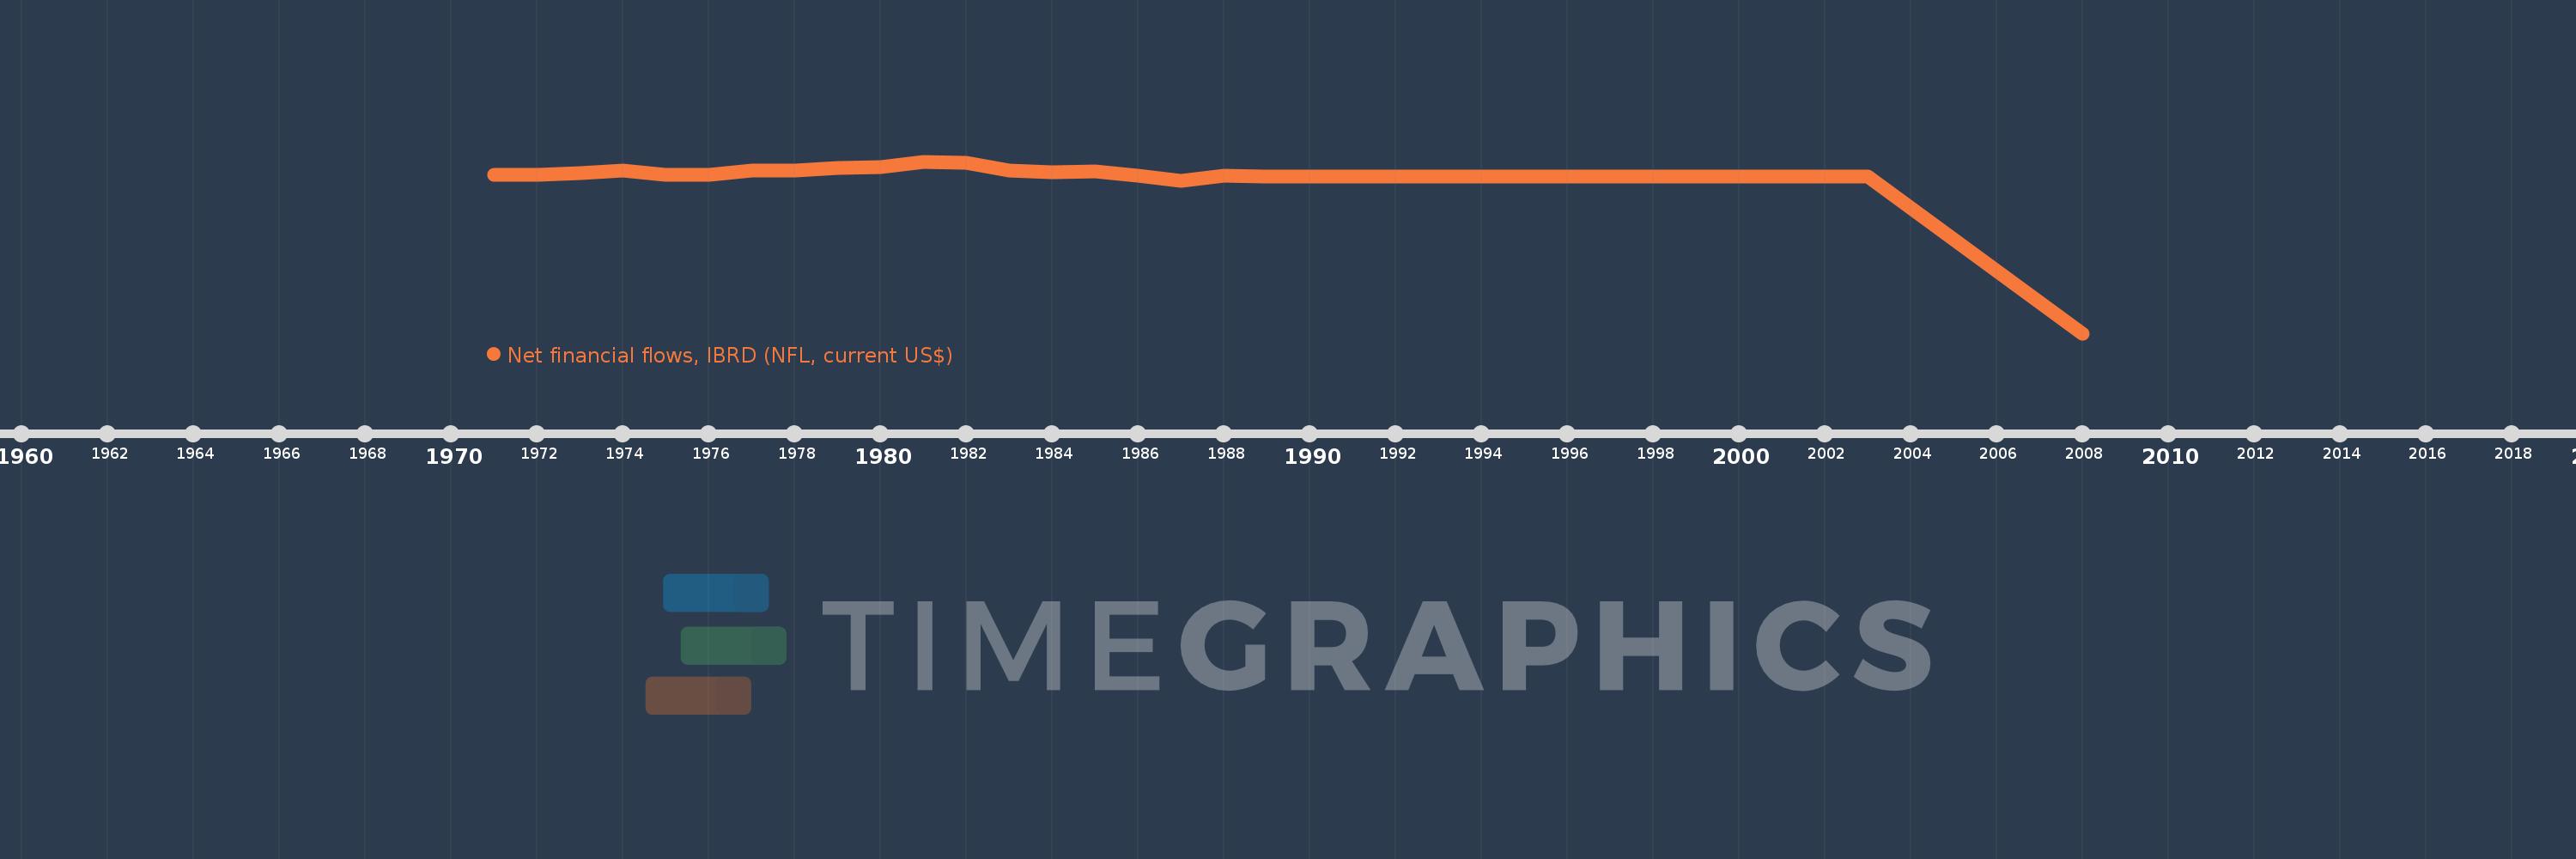
Cette échelle de temps montre un graphique de 1971 année à 2008 année Liberia. Les données jusqu'à 1970 année ne sont pas présentés. Quantité d'observations actuelles selon dates: 21.
Source (désignation):
Les indicateurs du développement mondiale
Source (organisation):
World Bank, International Debt Statistics.
Catégories:
External Debt
Dernière mise à jour
23 avr. 2017
Les indicateurs de changement de valeurs selon les années
En moyenne:
-3.402 mln.
Minimum:
-162.52 mln.
1 janv. 2008
Maximum:
15.64 mln.
1 janv. 1981
Pour la date d''observation
Valeur
Changement absolu
Le changement par rapport à la valeur précédente
1 janv. 1971
1.749 mln.
+1.749 mln.
0.0%
1 janv. 1972
1.806 mln.
+57.0 milles
3.26%
1 janv. 1973
3.307 mln.
+1.501 mln.
83.11%
1 janv. 1974
5.973 mln.
+2.666 mln.
80.62%
1 janv. 1975
2.248 mln.
-3.725 mln.
-62.36%
1 janv. 1976
1.5 mln.
-748.0 milles
-33.27%
1 janv. 1977
6.523 mln.
+5.023 mln.
334.87%
1 janv. 1978
6.522 mln.
-1000.0
-0.02%
1 janv. 1979
8.526 mln.
+2.004 mln.
30.73%
1 janv. 1980
9.93 mln.
+1.404 mln.
16.47%
1 janv. 1981
15.64 mln.
+5.71 mln.
57.5%
1 janv. 1982
14.573 mln.
-1.067 mln.
-6.82%
1 janv. 1983
5.933 mln.
-8.64 mln.
-59.29%
1 janv. 1984
4.241 mln.
-1.692 mln.
-28.52%
1 janv. 1985
5.186 mln.
+945.0 milles
22.28%
1 janv. 1986
650.0 milles
-4.536 mln.
-87.47%
1 janv. 1987
-4.653 mln.
-5.303 mln.
-815.85%
1 janv. 1988
1.378 mln.
+6.031 mln.
-129.62%
1 janv. 1989
51.0 milles
-1.327 mln.
-96.3%
1 janv. 2003
0.0
-51.0 milles
-100.0%
1 janv. 2008
-162.52 mln.
-162.52 mln.
%
Classement des pays selon les statistiques actuelles par années

Commentaires:

Envoyer
PremiumAbout & FeedbackUn accordConfidentialité
logo
© 2022 Selected Technologies LLC – Morgan Hill, California