33
/fr/
AIzaSyAYiBZKx7MnpbEhh9jyipgxe19OcubqV5w
May 1, 2025
245972
South Africa
ZAF
true
2
1
Net financial flows, IBRD (NFL, current US$)
2016,2015,2014,2013,2012,2011,2010,2009,2008,2007,2006,2005,2004,2003,2002,2001,2000
Download
Bibliothèque de statistiques globales →South Africa →

Net financial flows, IBRD (NFL, current US$)

Cette statistique dans les autres pays:

AlbaniaAlgeriaAngolaArgentinaArmeniaAzerbaijanBangladeshBelarusBelizeBoliviaBosnia and HerzegovinaBotswanaBrazilBulgariaBurundiCabo VerdeCameroonCaribbean small statesCentral Europe and the BalticsChadChinaColombiaCongo, Dem. Rep.Congo, Rep.Costa RicaCote d'IvoireCroatiaCzech RepublicDominicaDominican RepublicEarly-demographic dividendEast Asia & PacificEast Asia & Pacific (excluding high income)East Asia & Pacific (IDA & IBRD countries)EcuadorEgypt, Arab Rep.El SalvadorEquatorial GuineaEstoniaEthiopiaEurope & Central AsiaEurope & Central Asia (excluding high income)Europe & Central Asia (IDA & IBRD countries)FijiFragile and conflict affected situationsGabonGeorgiaGhanaGreeceGrenadaGuatemalaGuineaGuyanaHondurasHungaryIBRD onlyIDA & IBRD totalIDA blendIDA onlyIDA totalIndiaIndonesiaIran, Islamic Rep.JamaicaJordanKazakhstanKenyaKorea, Rep.KosovoLate-demographic dividendLatin America & Caribbean Latin America & Caribbean (excluding high income)Latin America & the Caribbean (IDA & IBRD countries)LebanonLesothoLiberiaLow & middle incomeLow incomeLower middle incomeMacedonia, FYRMadagascarMalawiMalaysiaMauritaniaMauritiusMexicoMiddle East & North AfricaMiddle East & North Africa (excluding high income)Middle East & North Africa (IDA & IBRD countries)Middle incomeMoldovaMontenegroMoroccoMyanmarNicaraguaNigeriaOmanOther small statesPacific island small statesPakistanPanamaPapua New GuineaParaguayPeruPhilippinesPolandPre-demographic dividendRomaniaRussian FederationSenegalSerbiaSeychellesSierra LeoneSlovak RepublicSloveniaSmall statesSouth AfricaSouth AsiaSouth Asia (IDA & IBRD)Sri LankaSt. Kitts and NevisSt. LuciaSt. Vincent and the GrenadinesSub-Saharan Africa Sub-Saharan Africa (excluding high income)Sub-Saharan Africa (IDA & IBRD countries)SudanSwazilandSyrian Arab RepublicTanzaniaThailandTogoTrinidad and TobagoTunisiaTurkeyTurkmenistanUgandaUkraineUpper middle incomeUzbekistanVenezuela, RBVietnamZambiaZimbabwe

La ligne de temps

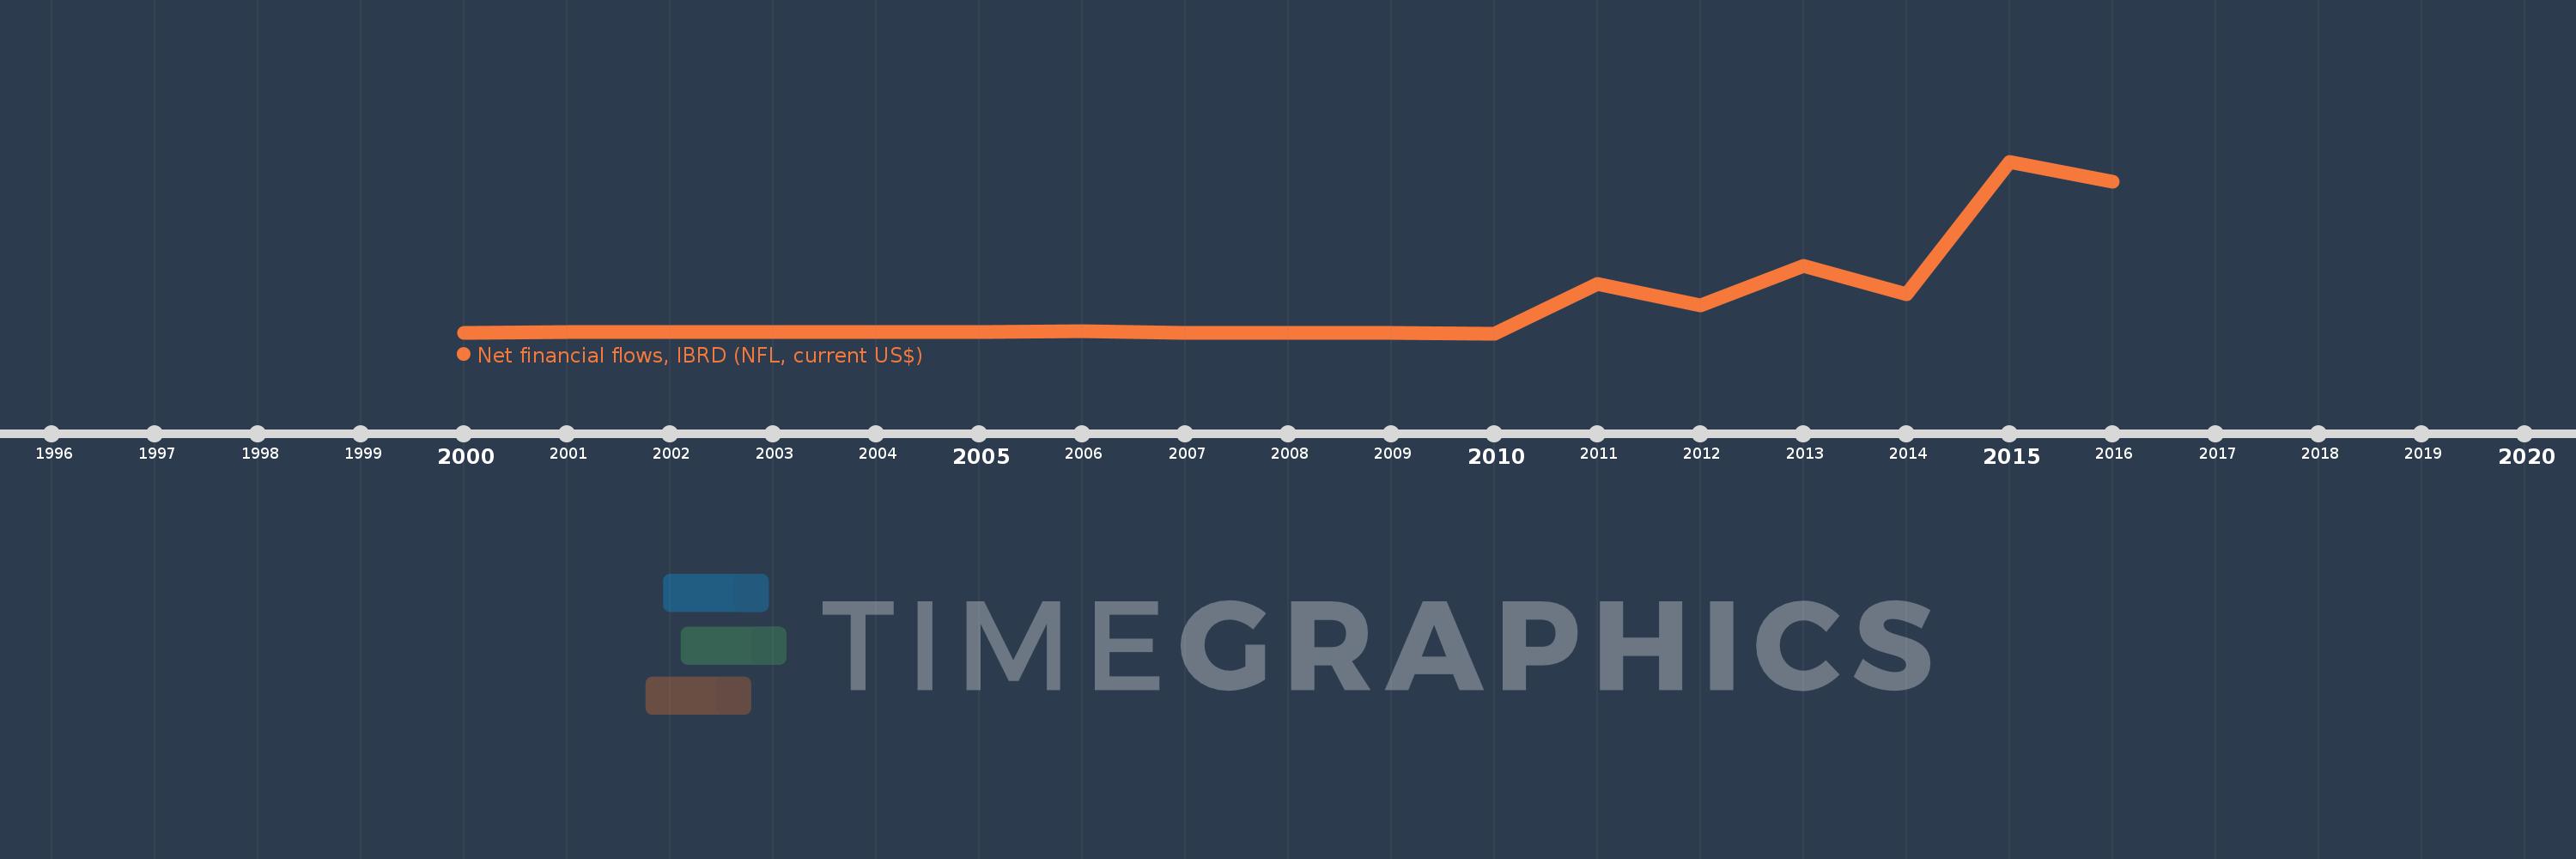
Cette échelle de temps montre un graphique de 2000 année à 2016 année South Africa. Les données jusqu'à 1999 année ne sont pas présentés. Quantité d'observations actuelles selon dates: 17.

Source (désignation):

Les indicateurs du développement mondiale

Source (organisation):

World Bank, International Debt Statistics.

Catégories:

External Debt

Dernière mise à jour

23 avr. 2017

Les indicateurs de changement de valeurs selon les années

En moyenne:
220.876 mln.
Minimum:
-5.495 mln.
1 janv. 2010
Maximum:
1.27 mds
1 janv. 2015
Pour la date d''observation
Valeur
Changement absolu
Le changement par rapport à la valeur précédente
1 janv. 2000
710.0 milles
+710.0 milles
0.0%
1 janv. 2001
2.661 mln.
+1.951 mln.
274.79%
1 janv. 2002
3.985 mln.
+1.324 mln.
49.76%
1 janv. 2003
5.142 mln.
+1.157 mln.
29.03%
1 janv. 2004
3.135 mln.
-2.007 mln.
-39.03%
1 janv. 2005
6.961 mln.
+3.826 mln.
122.04%
1 janv. 2006
8.26 mln.
+1.299 mln.
18.66%
1 janv. 2007
-1.844 mln.
-10.104 mln.
-122.32%
1 janv. 2008
-2.509 mln.
-665.0 milles
36.06%
1 janv. 2009
-333.0 milles
+2.176 mln.
-86.73%
1 janv. 2010
-5.495 mln.
-5.162 mln.
1.55 milles%
1 janv. 2011
363.061 mln.
+368.556 mln.
-6.71 milles%
1 janv. 2012
199.375 mln.
-163.686 mln.
-45.08%
1 janv. 2013
493.903 mln.
+294.528 mln.
147.73%
1 janv. 2014
284.362 mln.
-209.541 mln.
-42.43%
1 janv. 2015
1.27 mds
+985.746 mln.
346.65%
1 janv. 2016
1.123 mds
-146.704 mln.
-11.55%

Classement des pays selon les statistiques actuelles par années