33
/fr/
AIzaSyAYiBZKx7MnpbEhh9jyipgxe19OcubqV5w
August 1, 2025
200719
Montenegro
MNE
true
2
1
Net financial flows, IBRD (NFL, current US$)
2016,2015,2014,2013,2012,2011,2010,2009,2008,2007
Download
Bibliothèque de statistiques globales →Montenegro →

Net financial flows, IBRD (NFL, current US$)

Cette statistique dans les autres pays:

AlbaniaAlgeriaAngolaArgentinaArmeniaAzerbaijanBangladeshBelarusBelizeBoliviaBosnia and HerzegovinaBotswanaBrazilBulgariaBurundiCabo VerdeCameroonCaribbean small statesCentral Europe and the BalticsChadChinaColombiaCongo, Dem. Rep.Congo, Rep.Costa RicaCote d'IvoireCroatiaCzech RepublicDominicaDominican RepublicEarly-demographic dividendEast Asia & PacificEast Asia & Pacific (excluding high income)East Asia & Pacific (IDA & IBRD countries)EcuadorEgypt, Arab Rep.El SalvadorEquatorial GuineaEstoniaEthiopiaEurope & Central AsiaEurope & Central Asia (excluding high income)Europe & Central Asia (IDA & IBRD countries)FijiFragile and conflict affected situationsGabonGeorgiaGhanaGreeceGrenadaGuatemalaGuineaGuyanaHondurasHungaryIBRD onlyIDA & IBRD totalIDA blendIDA onlyIDA totalIndiaIndonesiaIran, Islamic Rep.JamaicaJordanKazakhstanKenyaKorea, Rep.KosovoLate-demographic dividendLatin America & Caribbean Latin America & Caribbean (excluding high income)Latin America & the Caribbean (IDA & IBRD countries)LebanonLesothoLiberiaLow & middle incomeLow incomeLower middle incomeMacedonia, FYRMadagascarMalawiMalaysiaMauritaniaMauritiusMexicoMiddle East & North AfricaMiddle East & North Africa (excluding high income)Middle East & North Africa (IDA & IBRD countries)Middle incomeMoldovaMontenegroMoroccoMyanmarNicaraguaNigeriaOmanOther small statesPacific island small statesPakistanPanamaPapua New GuineaParaguayPeruPhilippinesPolandPre-demographic dividendRomaniaRussian FederationSenegalSerbiaSeychellesSierra LeoneSlovak RepublicSloveniaSmall statesSouth AfricaSouth AsiaSouth Asia (IDA & IBRD)Sri LankaSt. Kitts and NevisSt. LuciaSt. Vincent and the GrenadinesSub-Saharan Africa Sub-Saharan Africa (excluding high income)Sub-Saharan Africa (IDA & IBRD countries)SudanSwazilandSyrian Arab RepublicTanzaniaThailandTogoTrinidad and TobagoTunisiaTurkeyTurkmenistanUgandaUkraineUpper middle incomeUzbekistanVenezuela, RBVietnamZambiaZimbabwe

La ligne de temps

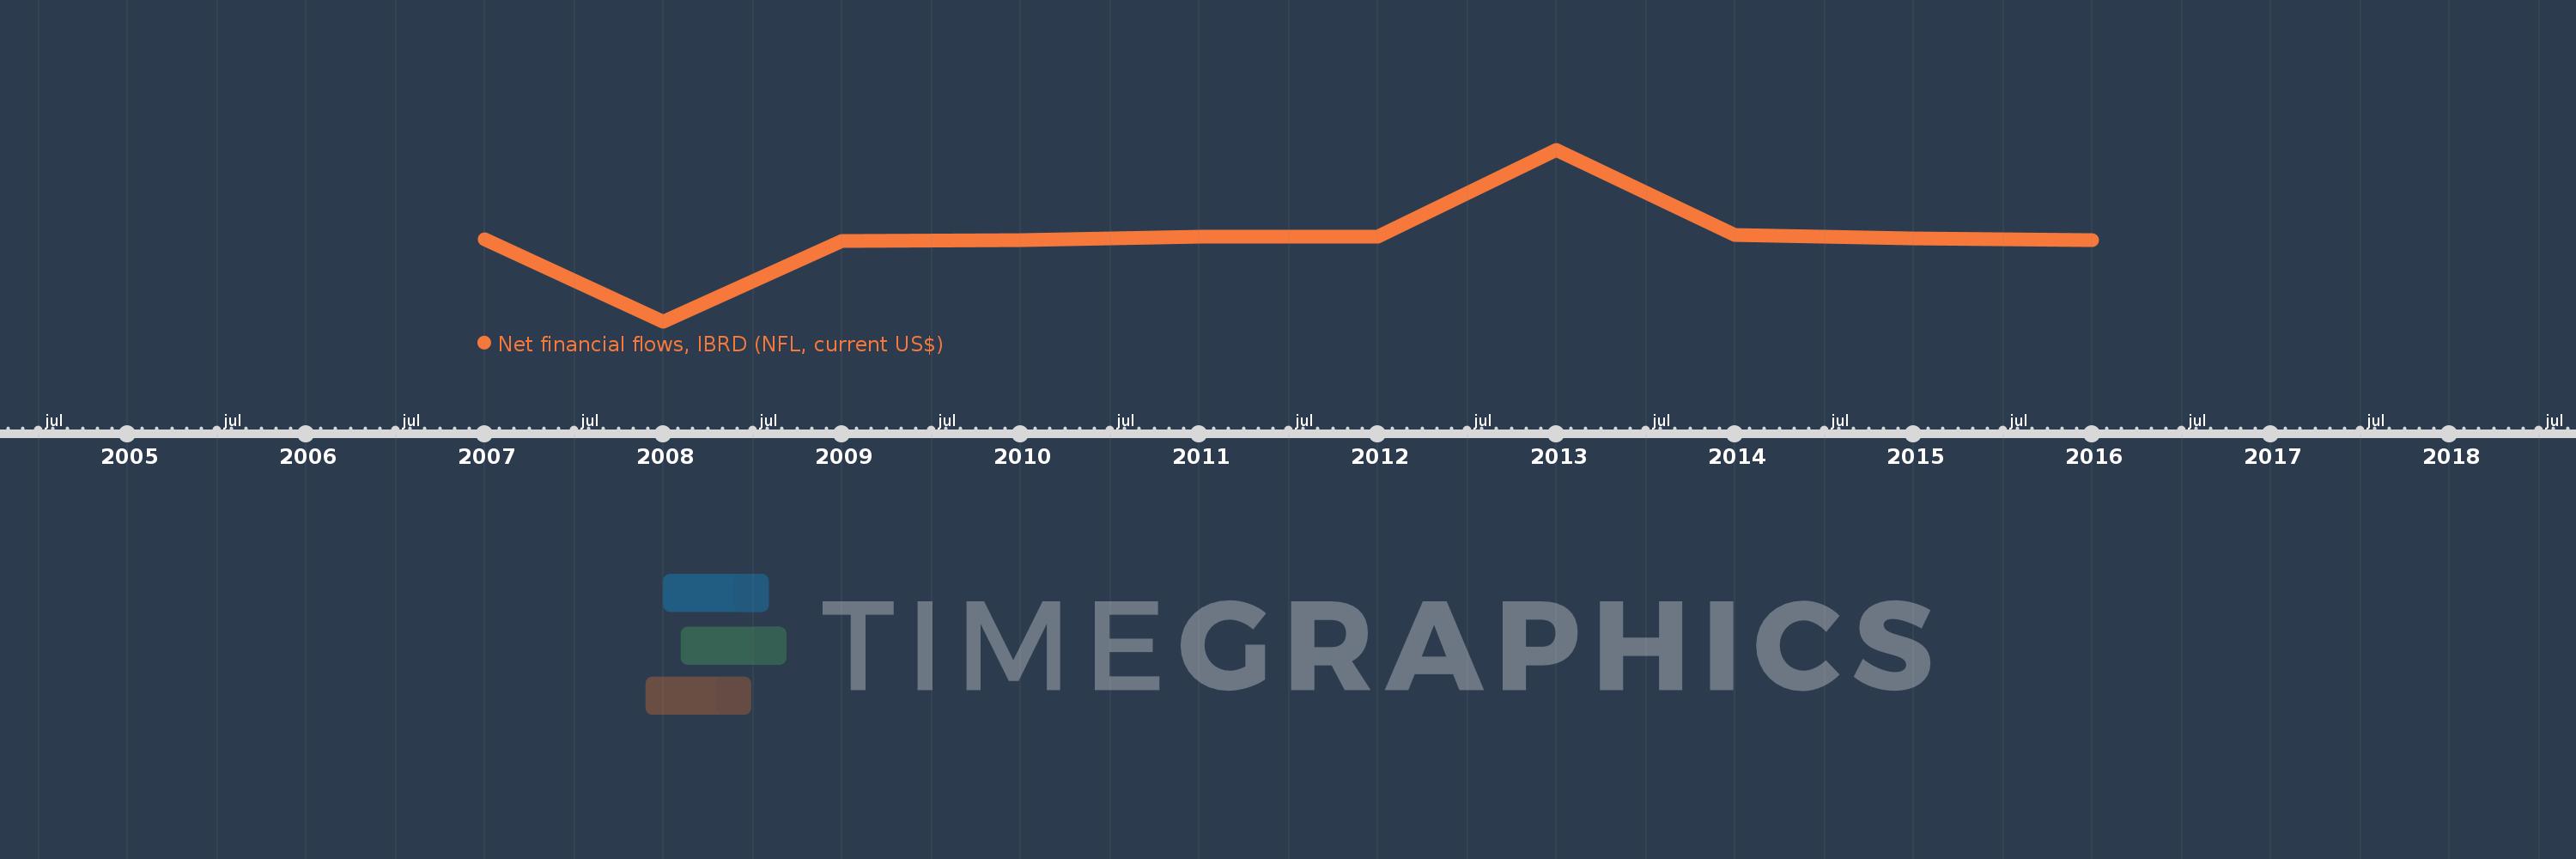
Cette échelle de temps montre un graphique de 2007 année à 2016 année Montenegro. Les données jusqu'à 2006 année ne sont pas présentés. Quantité d'observations actuelles selon dates: 10.

Source (désignation):

Les indicateurs du développement mondiale

Source (organisation):

World Bank, International Debt Statistics.

Catégories:

External Debt

Dernière mise à jour

23 avr. 2017

Les indicateurs de changement de valeurs selon les années

En moyenne:
-6.785 mln.
Minimum:
-95.508 mln.
1 janv. 2008
Maximum:
85.796 mln.
1 janv. 2013
Pour la date d''observation
Valeur
Changement absolu
Le changement par rapport à la valeur précédente
1 janv. 2007
-7.804 mln.
-7.804 mln.
0.0%
1 janv. 2008
-95.508 mln.
-87.704 mln.
1.12 milles%
1 janv. 2009
-10.434 mln.
+85.074 mln.
-89.08%
1 janv. 2010
-8.863 mln.
+1.571 mln.
-15.06%
1 janv. 2011
-5.933 mln.
+2.93 mln.
-33.06%
1 janv. 2012
-5.885 mln.
+48.0 milles
-0.81%
1 janv. 2013
85.796 mln.
+91.681 mln.
-1.56 milles%
1 janv. 2014
-3.302 mln.
-89.098 mln.
-103.85%
1 janv. 2015
-7.108 mln.
-3.806 mln.
115.26%
1 janv. 2016
-8.807 mln.
-1.699 mln.
23.9%

Classement des pays selon les statistiques actuelles par années