33
/fr/
AIzaSyAYiBZKx7MnpbEhh9jyipgxe19OcubqV5w
August 1, 2025
197927
Moldova
MDA
true
2
1
Net financial flows, IBRD (NFL, current US$)
2016,2015,2014,2013,2012,2011,2010,2009,2008,2007,2006,2005,2004,2003,2002,2001,2000,1999,1998,1996,1995,1994
Download
Bibliothèque de statistiques globales →Moldova →

Net financial flows, IBRD (NFL, current US$)

Cette statistique dans les autres pays:

AlbaniaAlgeriaAngolaArgentinaArmeniaAzerbaijanBangladeshBelarusBelizeBoliviaBosnia and HerzegovinaBotswanaBrazilBulgariaBurundiCabo VerdeCameroonCaribbean small statesCentral Europe and the BalticsChadChinaColombiaCongo, Dem. Rep.Congo, Rep.Costa RicaCote d'IvoireCroatiaCzech RepublicDominicaDominican RepublicEarly-demographic dividendEast Asia & PacificEast Asia & Pacific (excluding high income)East Asia & Pacific (IDA & IBRD countries)EcuadorEgypt, Arab Rep.El SalvadorEquatorial GuineaEstoniaEthiopiaEurope & Central AsiaEurope & Central Asia (excluding high income)Europe & Central Asia (IDA & IBRD countries)FijiFragile and conflict affected situationsGabonGeorgiaGhanaGreeceGrenadaGuatemalaGuineaGuyanaHondurasHungaryIBRD onlyIDA & IBRD totalIDA blendIDA onlyIDA totalIndiaIndonesiaIran, Islamic Rep.JamaicaJordanKazakhstanKenyaKorea, Rep.KosovoLate-demographic dividendLatin America & Caribbean Latin America & Caribbean (excluding high income)Latin America & the Caribbean (IDA & IBRD countries)LebanonLesothoLiberiaLow & middle incomeLow incomeLower middle incomeMacedonia, FYRMadagascarMalawiMalaysiaMauritaniaMauritiusMexicoMiddle East & North AfricaMiddle East & North Africa (excluding high income)Middle East & North Africa (IDA & IBRD countries)Middle incomeMoldovaMontenegroMoroccoMyanmarNicaraguaNigeriaOmanOther small statesPacific island small statesPakistanPanamaPapua New GuineaParaguayPeruPhilippinesPolandPre-demographic dividendRomaniaRussian FederationSenegalSerbiaSeychellesSierra LeoneSlovak RepublicSloveniaSmall statesSouth AfricaSouth AsiaSouth Asia (IDA & IBRD)Sri LankaSt. Kitts and NevisSt. LuciaSt. Vincent and the GrenadinesSub-Saharan Africa Sub-Saharan Africa (excluding high income)Sub-Saharan Africa (IDA & IBRD countries)SudanSwazilandSyrian Arab RepublicTanzaniaThailandTogoTrinidad and TobagoTunisiaTurkeyTurkmenistanUgandaUkraineUpper middle incomeUzbekistanVenezuela, RBVietnamZambiaZimbabwe

La ligne de temps

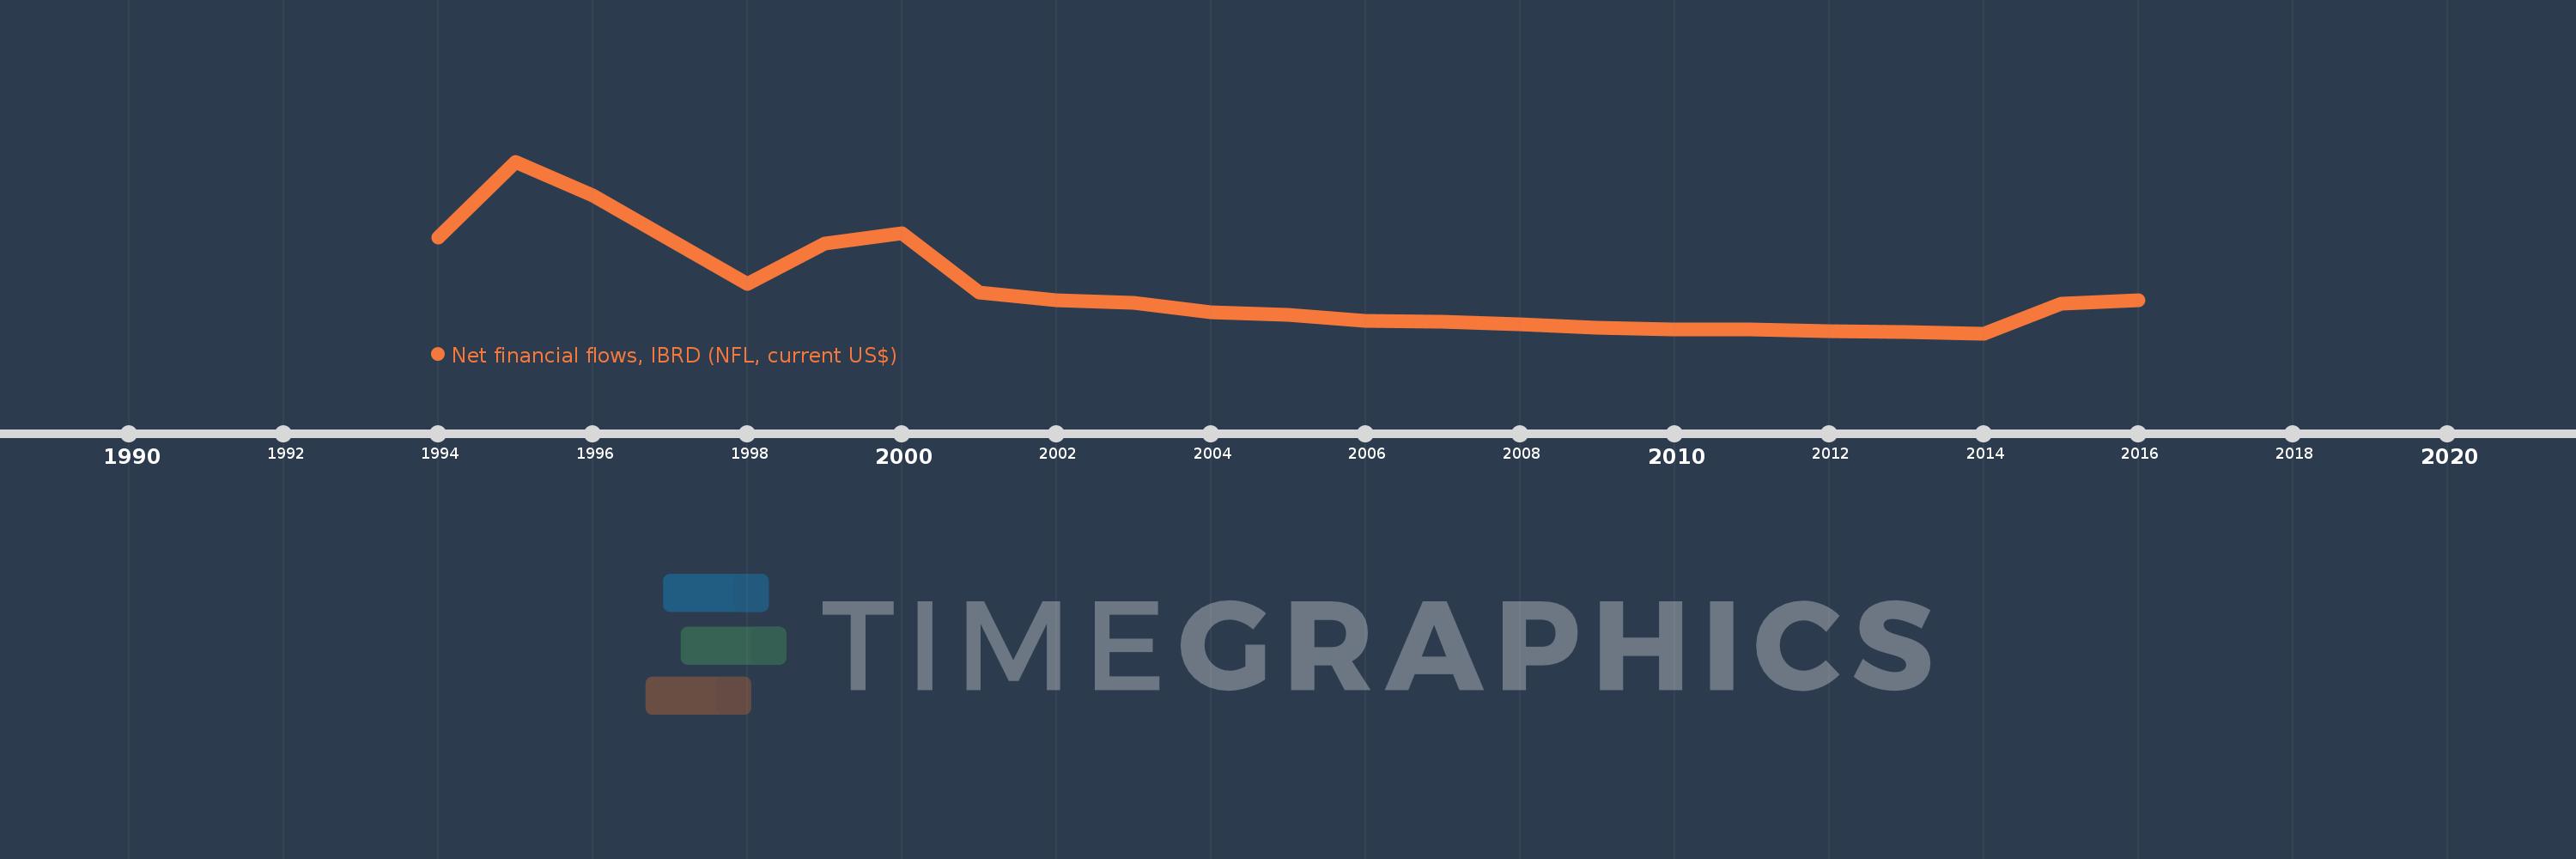
Cette échelle de temps montre un graphique de 1994 année à 2016 année Moldova. Les données jusqu'à 1993 année ne sont pas présentés. Quantité d'observations actuelles selon dates: 22.

Source (désignation):

Les indicateurs du développement mondiale

Source (organisation):

World Bank, International Debt Statistics.

Catégories:

External Debt

Dernière mise à jour

23 avr. 2017

Les indicateurs de changement de valeurs selon les années

En moyenne:
967.773 milles
Minimum:
-19.687 mln.
1 janv. 2014
Maximum:
67.092 mln.
1 janv. 1995
Pour la date d''observation
Valeur
Changement absolu
Le changement par rapport à la valeur précédente
1 janv. 1994
28.573 mln.
+28.573 mln.
0.0%
1 janv. 1995
67.092 mln.
+38.519 mln.
134.81%
1 janv. 1996
50.158 mln.
-16.934 mln.
-25.24%
1 janv. 1998
5.394 mln.
-44.764 mln.
-89.25%
1 janv. 1999
25.602 mln.
+20.208 mln.
374.64%
1 janv. 2000
30.654 mln.
+5.052 mln.
19.73%
1 janv. 2001
800.0 milles
-29.854 mln.
-97.39%
1 janv. 2002
-3.137 mln.
-3.937 mln.
-492.13%
1 janv. 2003
-4.42 mln.
-1.283 mln.
40.9%
1 janv. 2004
-9.073 mln.
-4.653 mln.
105.27%
1 janv. 2005
-10.398 mln.
-1.325 mln.
14.6%
1 janv. 2006
-13.397 mln.
-2.999 mln.
28.84%
1 janv. 2007
-13.884 mln.
-487.0 milles
3.64%
1 janv. 2008
-15.039 mln.
-1.155 mln.
8.32%
1 janv. 2009
-16.847 mln.
-1.808 mln.
12.02%
1 janv. 2010
-17.592 mln.
-745.0 milles
4.42%
1 janv. 2011
-17.767 mln.
-175.0 milles
0.99%
1 janv. 2012
-18.579 mln.
-812.0 milles
4.57%
1 janv. 2013
-19.213 mln.
-634.0 milles
3.41%
1 janv. 2014
-19.687 mln.
-474.0 milles
2.47%
1 janv. 2015
-4.778 mln.
+14.909 mln.
-75.73%
1 janv. 2016
-3.171 mln.
+1.607 mln.
-33.63%

Classement des pays selon les statistiques actuelles par années