33
/fr/
AIzaSyAYiBZKx7MnpbEhh9jyipgxe19OcubqV5w
August 1, 2025
177980
Lesotho
LSO
true
2
1
Net financial flows, IBRD (NFL, current US$)
2014,2013,2012,2011,2010,2009,2008,2007,2006,2005,2004,2003,2002,2001,2000,1999,1998,1997,1996,1995,1994,1993
Download
Bibliothèque de statistiques globales →Lesotho →

Net financial flows, IBRD (NFL, current US$)

Cette statistique dans les autres pays:

AlbaniaAlgeriaAngolaArgentinaArmeniaAzerbaijanBangladeshBelarusBelizeBoliviaBosnia and HerzegovinaBotswanaBrazilBulgariaBurundiCabo VerdeCameroonCaribbean small statesCentral Europe and the BalticsChadChinaColombiaCongo, Dem. Rep.Congo, Rep.Costa RicaCote d'IvoireCroatiaCzech RepublicDominicaDominican RepublicEarly-demographic dividendEast Asia & PacificEast Asia & Pacific (excluding high income)East Asia & Pacific (IDA & IBRD countries)EcuadorEgypt, Arab Rep.El SalvadorEquatorial GuineaEstoniaEthiopiaEurope & Central AsiaEurope & Central Asia (excluding high income)Europe & Central Asia (IDA & IBRD countries)FijiFragile and conflict affected situationsGabonGeorgiaGhanaGreeceGrenadaGuatemalaGuineaGuyanaHondurasHungaryIBRD onlyIDA & IBRD totalIDA blendIDA onlyIDA totalIndiaIndonesiaIran, Islamic Rep.JamaicaJordanKazakhstanKenyaKorea, Rep.KosovoLate-demographic dividendLatin America & Caribbean Latin America & Caribbean (excluding high income)Latin America & the Caribbean (IDA & IBRD countries)LebanonLesothoLiberiaLow & middle incomeLow incomeLower middle incomeMacedonia, FYRMadagascarMalawiMalaysiaMauritaniaMauritiusMexicoMiddle East & North AfricaMiddle East & North Africa (excluding high income)Middle East & North Africa (IDA & IBRD countries)Middle incomeMoldovaMontenegroMoroccoMyanmarNicaraguaNigeriaOmanOther small statesPacific island small statesPakistanPanamaPapua New GuineaParaguayPeruPhilippinesPolandPre-demographic dividendRomaniaRussian FederationSenegalSerbiaSeychellesSierra LeoneSlovak RepublicSloveniaSmall statesSouth AfricaSouth AsiaSouth Asia (IDA & IBRD)Sri LankaSt. Kitts and NevisSt. LuciaSt. Vincent and the GrenadinesSub-Saharan Africa Sub-Saharan Africa (excluding high income)Sub-Saharan Africa (IDA & IBRD countries)SudanSwazilandSyrian Arab RepublicTanzaniaThailandTogoTrinidad and TobagoTunisiaTurkeyTurkmenistanUgandaUkraineUpper middle incomeUzbekistanVenezuela, RBVietnamZambiaZimbabwe

La ligne de temps

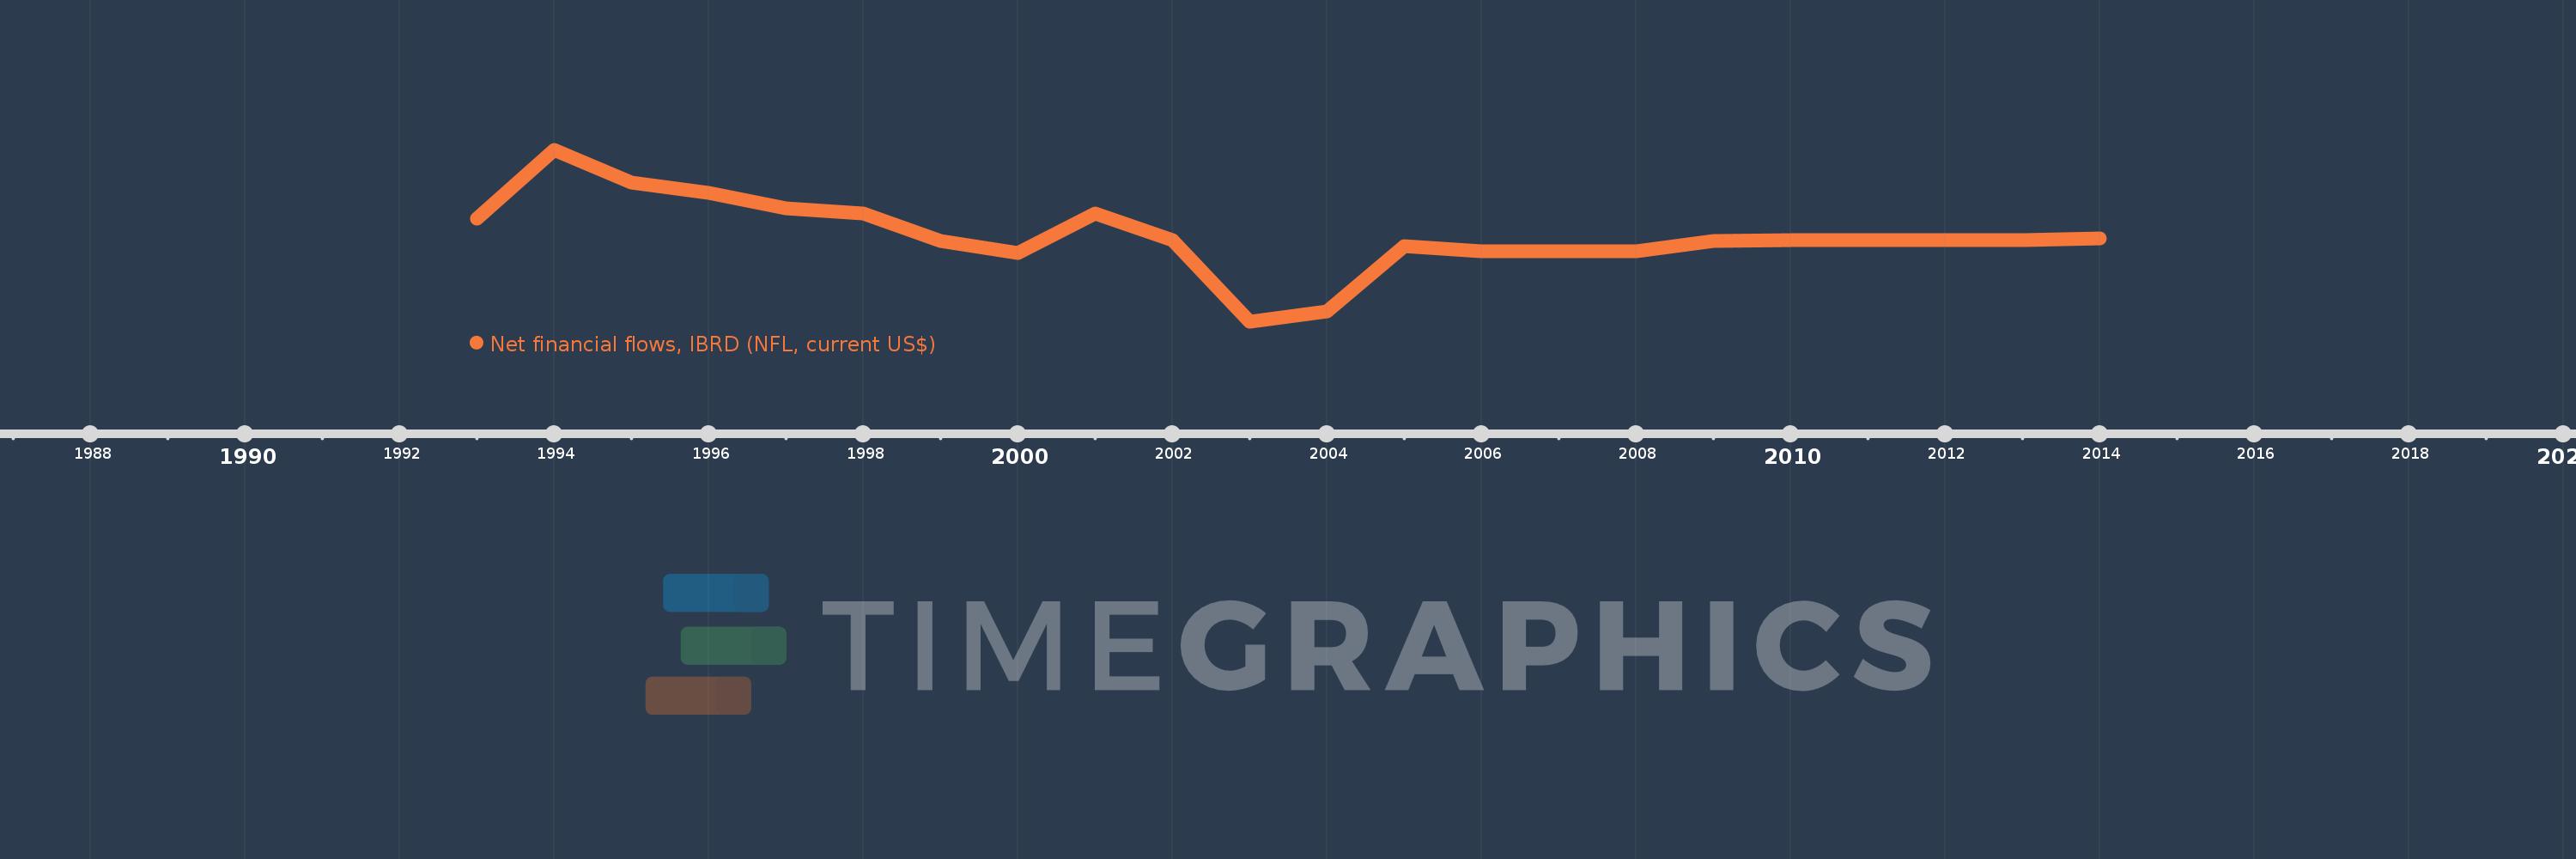
Cette échelle de temps montre un graphique de 1993 année à 2014 année Lesotho. Les données jusqu'à 1992 année ne sont pas présentés. Quantité d'observations actuelles selon dates: 22.

Source (désignation):

Les indicateurs du développement mondiale

Source (organisation):

World Bank, International Debt Statistics.

Catégories:

External Debt

Dernière mise à jour

23 avr. 2017

Les indicateurs de changement de valeurs selon les années

En moyenne:
332.409 milles
Minimum:
-21.289 mln.
1 janv. 2003
Maximum:
21.793 mln.
1 janv. 1994
Pour la date d''observation
Valeur
Changement absolu
Le changement par rapport à la valeur précédente
1 janv. 1993
4.612 mln.
+4.612 mln.
0.0%
1 janv. 1994
21.793 mln.
+17.181 mln.
372.53%
1 janv. 1995
13.729 mln.
-8.064 mln.
-37.0%
1 janv. 1996
11.167 mln.
-2.562 mln.
-18.66%
1 janv. 1997
7.159 mln.
-4.008 mln.
-35.89%
1 janv. 1998
5.995 mln.
-1.164 mln.
-16.26%
1 janv. 1999
-1.066 mln.
-7.061 mln.
-117.78%
1 janv. 2000
-4.066 mln.
-3.0 mln.
281.43%
1 janv. 2001
5.967 mln.
+10.033 mln.
-246.75%
1 janv. 2002
-789.0 milles
-6.756 mln.
-113.22%
1 janv. 2003
-21.289 mln.
-20.5 mln.
2.6 milles%
1 janv. 2004
-18.554 mln.
+2.735 mln.
-12.85%
1 janv. 2005
-2.368 mln.
+16.186 mln.
-87.24%
1 janv. 2006
-3.533 mln.
-1.165 mln.
49.2%
1 janv. 2007
-3.6 mln.
-67.0 milles
1.9%
1 janv. 2008
-3.6 mln.
0.0
0.0%
1 janv. 2009
-981.0 milles
+2.619 mln.
-72.75%
1 janv. 2010
-725.0 milles
+256.0 milles
-26.1%
1 janv. 2011
-725.0 milles
0.0
0.0%
1 janv. 2012
-725.0 milles
0.0
0.0%
1 janv. 2013
-725.0 milles
0.0
0.0%
1 janv. 2014
-363.0 milles
+362.0 milles
-49.93%

Classement des pays selon les statistiques actuelles par années