33
/fr/
AIzaSyAYiBZKx7MnpbEhh9jyipgxe19OcubqV5w
August 1, 2025
138395
Georgia
GEO
true
2
1
Net financial flows, IBRD (NFL, current US$)
2016,2015,2014,2013,2012,2011,2010
Download
Bibliothèque de statistiques globales →Georgia →

Net financial flows, IBRD (NFL, current US$)

Cette statistique dans les autres pays:

AlbaniaAlgeriaAngolaArgentinaArmeniaAzerbaijanBangladeshBelarusBelizeBoliviaBosnia and HerzegovinaBotswanaBrazilBulgariaBurundiCabo VerdeCameroonCaribbean small statesCentral Europe and the BalticsChadChinaColombiaCongo, Dem. Rep.Congo, Rep.Costa RicaCote d'IvoireCroatiaCzech RepublicDominicaDominican RepublicEarly-demographic dividendEast Asia & PacificEast Asia & Pacific (excluding high income)East Asia & Pacific (IDA & IBRD countries)EcuadorEgypt, Arab Rep.El SalvadorEquatorial GuineaEstoniaEthiopiaEurope & Central AsiaEurope & Central Asia (excluding high income)Europe & Central Asia (IDA & IBRD countries)FijiFragile and conflict affected situationsGabonGeorgiaGhanaGreeceGrenadaGuatemalaGuineaGuyanaHondurasHungaryIBRD onlyIDA & IBRD totalIDA blendIDA onlyIDA totalIndiaIndonesiaIran, Islamic Rep.JamaicaJordanKazakhstanKenyaKorea, Rep.KosovoLate-demographic dividendLatin America & Caribbean Latin America & Caribbean (excluding high income)Latin America & the Caribbean (IDA & IBRD countries)LebanonLesothoLiberiaLow & middle incomeLow incomeLower middle incomeMacedonia, FYRMadagascarMalawiMalaysiaMauritaniaMauritiusMexicoMiddle East & North AfricaMiddle East & North Africa (excluding high income)Middle East & North Africa (IDA & IBRD countries)Middle incomeMoldovaMontenegroMoroccoMyanmarNicaraguaNigeriaOmanOther small statesPacific island small statesPakistanPanamaPapua New GuineaParaguayPeruPhilippinesPolandPre-demographic dividendRomaniaRussian FederationSenegalSerbiaSeychellesSierra LeoneSlovak RepublicSloveniaSmall statesSouth AfricaSouth AsiaSouth Asia (IDA & IBRD)Sri LankaSt. Kitts and NevisSt. LuciaSt. Vincent and the GrenadinesSub-Saharan Africa Sub-Saharan Africa (excluding high income)Sub-Saharan Africa (IDA & IBRD countries)SudanSwazilandSyrian Arab RepublicTanzaniaThailandTogoTrinidad and TobagoTunisiaTurkeyTurkmenistanUgandaUkraineUpper middle incomeUzbekistanVenezuela, RBVietnamZambiaZimbabwe

La ligne de temps

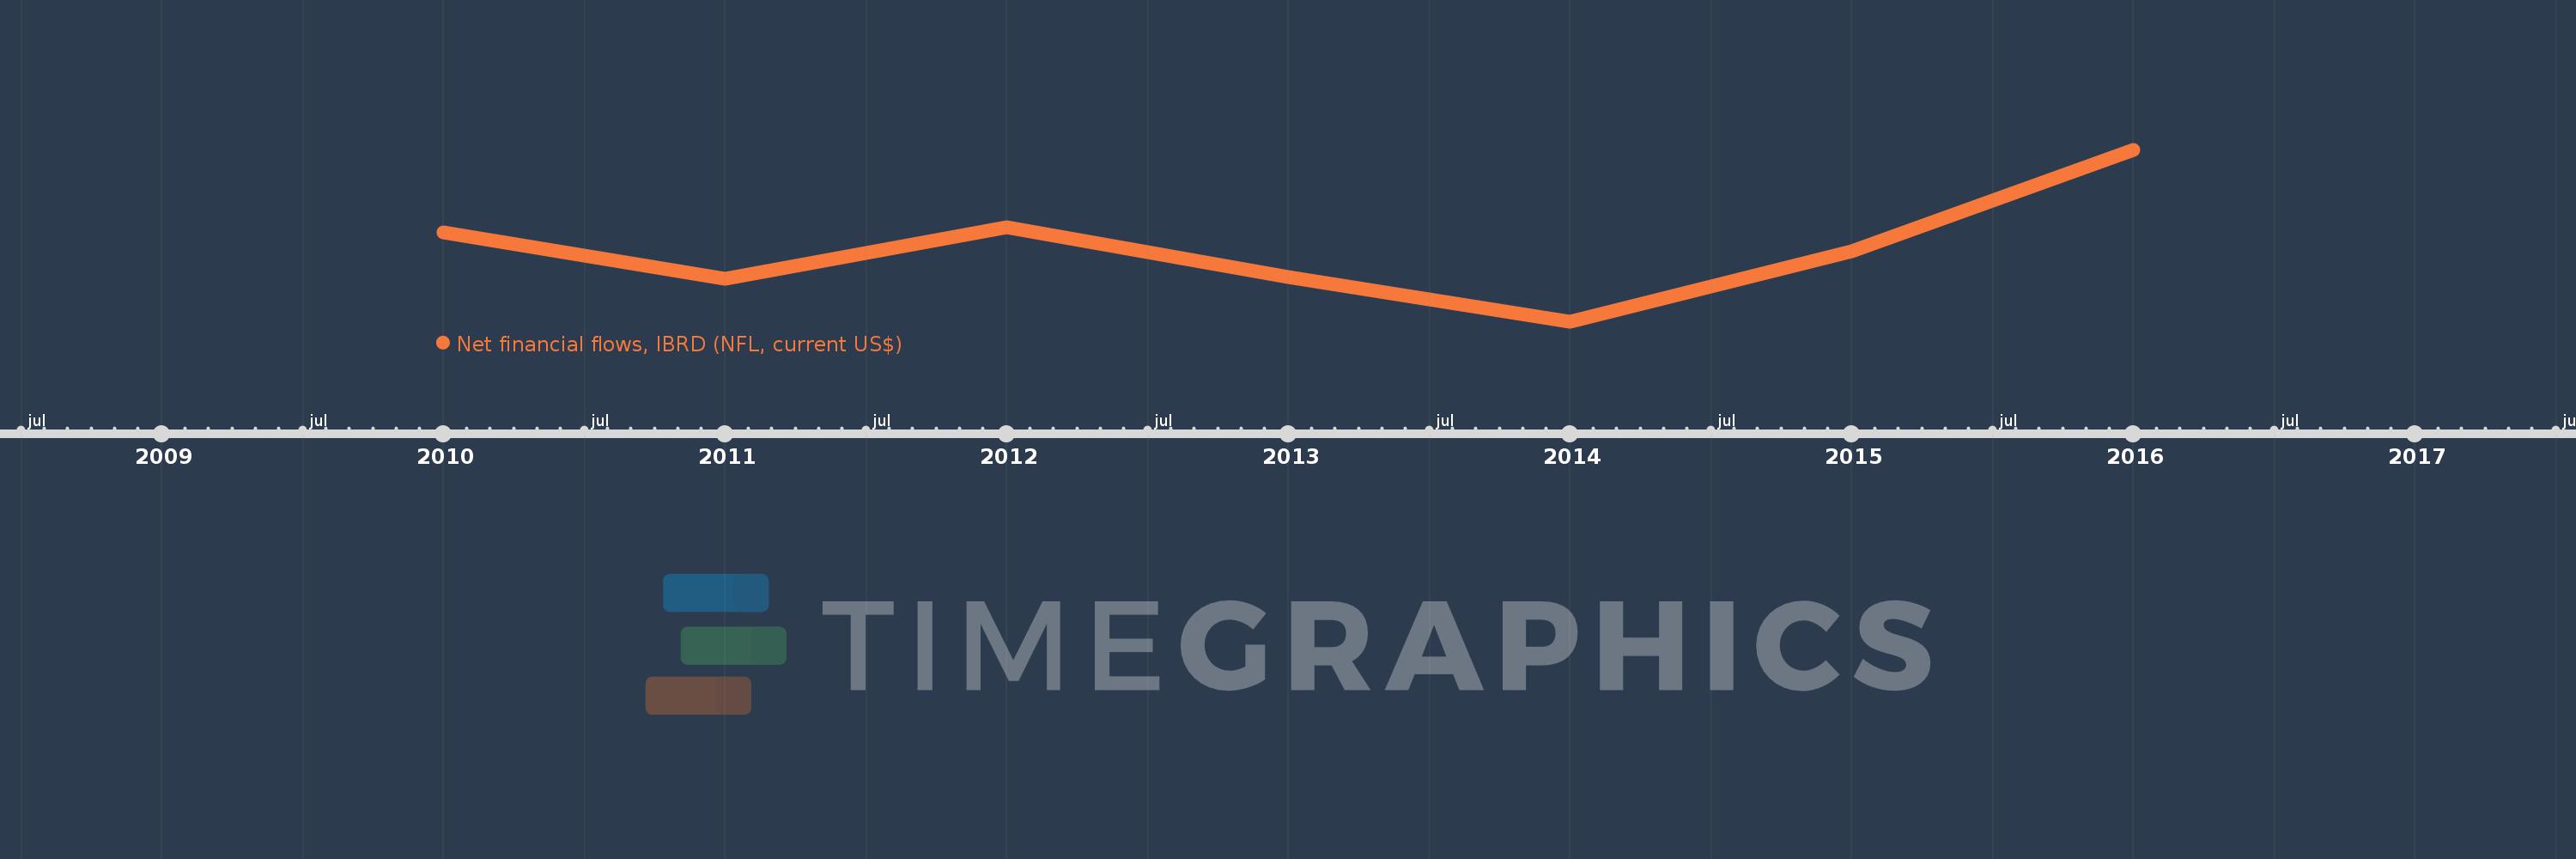
Cette échelle de temps montre un graphique de 2010 année à 2016 année Georgia. Les données jusqu'à 2009 année ne sont pas présentés. Quantité d'observations actuelles selon dates: 7.

Source (désignation):

Les indicateurs du développement mondiale

Source (organisation):

World Bank, International Debt Statistics.

Catégories:

External Debt

Dernière mise à jour

23 avr. 2017

Les indicateurs de changement de valeurs selon les années

En moyenne:
90.616 mln.
Minimum:
47.156 mln.
1 janv. 2014
Maximum:
148.522 mln.
1 janv. 2016
Pour la date d''observation
Valeur
Changement absolu
Le changement par rapport à la valeur précédente
1 janv. 2010
99.966 mln.
+99.966 mln.
0.0%
1 janv. 2011
72.847 mln.
-27.119 mln.
-27.13%
1 janv. 2012
102.973 mln.
+30.126 mln.
41.36%
1 janv. 2013
73.87 mln.
-29.103 mln.
-28.26%
1 janv. 2014
47.156 mln.
-26.714 mln.
-36.16%
1 janv. 2015
88.979 mln.
+41.823 mln.
88.69%
1 janv. 2016
148.522 mln.
+59.543 mln.
66.92%

Classement des pays selon les statistiques actuelles par années