33
/es/
AIzaSyAYiBZKx7MnpbEhh9jyipgxe19OcubqV5w
August 1, 2025
61783
Upper middle income
UMC
false
2
1
Listed domestic companies, total
2016,2015,2014,2013,2012,2011,2010,2009,2008,2007,2006,2005,2004,2003,2002,2001,2000,1999,1998,1997,1996,1995,1994
Download
Estadísticas Globales de la Biblioteca →Upper middle income →

Listed domestic companies, total

Estas estadísticas en otros países:

Arab WorldArgentinaArmeniaAustraliaAustriaAzerbaijanBahrainBangladeshBarbadosBelarusBelgiumBermudaBhutanBoliviaBosnia and HerzegovinaBotswanaBrazilBulgariaCanadaCayman IslandsCentral Europe and the BalticsChannel IslandsChileChinaColombiaCosta RicaCote d'IvoireCroatiaCyprusCzech RepublicDenmarkDominican RepublicEarly-demographic dividendEast Asia & PacificEast Asia & Pacific (excluding high income)East Asia & Pacific (IDA & IBRD countries)EcuadorEgypt, Arab Rep.El SalvadorEstoniaEuro areaEurope & Central AsiaEurope & Central Asia (excluding high income)Europe & Central Asia (IDA & IBRD countries)European UnionFijiFinlandFranceGeorgiaGermanyGhanaGreeceGuatemalaGuyanaHigh incomeHondurasHong Kong SAR, ChinaHungaryIBRD onlyIcelandIDA & IBRD totalIDA blendIDA totalIndiaIndonesiaIran, Islamic Rep.IrelandIsraelItalyJamaicaJapanJordanKazakhstanKenyaKorea, Dem. People’s Rep.Korea, Rep.KuwaitKyrgyz RepublicLate-demographic dividendLatin America & Caribbean Latin America & Caribbean (excluding high income)Latin America & the Caribbean (IDA & IBRD countries)LatviaLebanonLithuaniaLow & middle incomeLower middle incomeLuxembourgMacedonia, FYRMalawiMalaysiaMaltaMauritiusMexicoMiddle East & North AfricaMiddle East & North Africa (excluding high income)Middle East & North Africa (IDA & IBRD countries)Middle incomeMoldovaMongoliaMontenegroMoroccoNamibiaNepalNetherlandsNew ZealandNigeriaNorth AmericaNorwayOECD membersOmanOther small statesPakistanPanamaPapua New GuineaParaguayPeruPhilippinesPolandPortugalPost-demographic dividendQatarRomaniaRussian FederationSaudi ArabiaSerbiaSeychellesSingaporeSlovak RepublicSloveniaSouth AfricaSouth AsiaSouth Asia (IDA & IBRD)SpainSri LankaSt. Kitts and NevisSub-Saharan Africa Sub-Saharan Africa (excluding high income)Sub-Saharan Africa (IDA & IBRD countries)SwazilandSwedenSwitzerlandTanzaniaThailandTrinidad and TobagoTunisiaTurkeyUgandaUkraineUnited Arab EmiratesUnited KingdomUnited StatesUpper middle incomeUruguayUzbekistanVenezuela, RBVietnamWest Bank and GazaWorldZambiaZimbabwe

línea de tiempo (timeline):

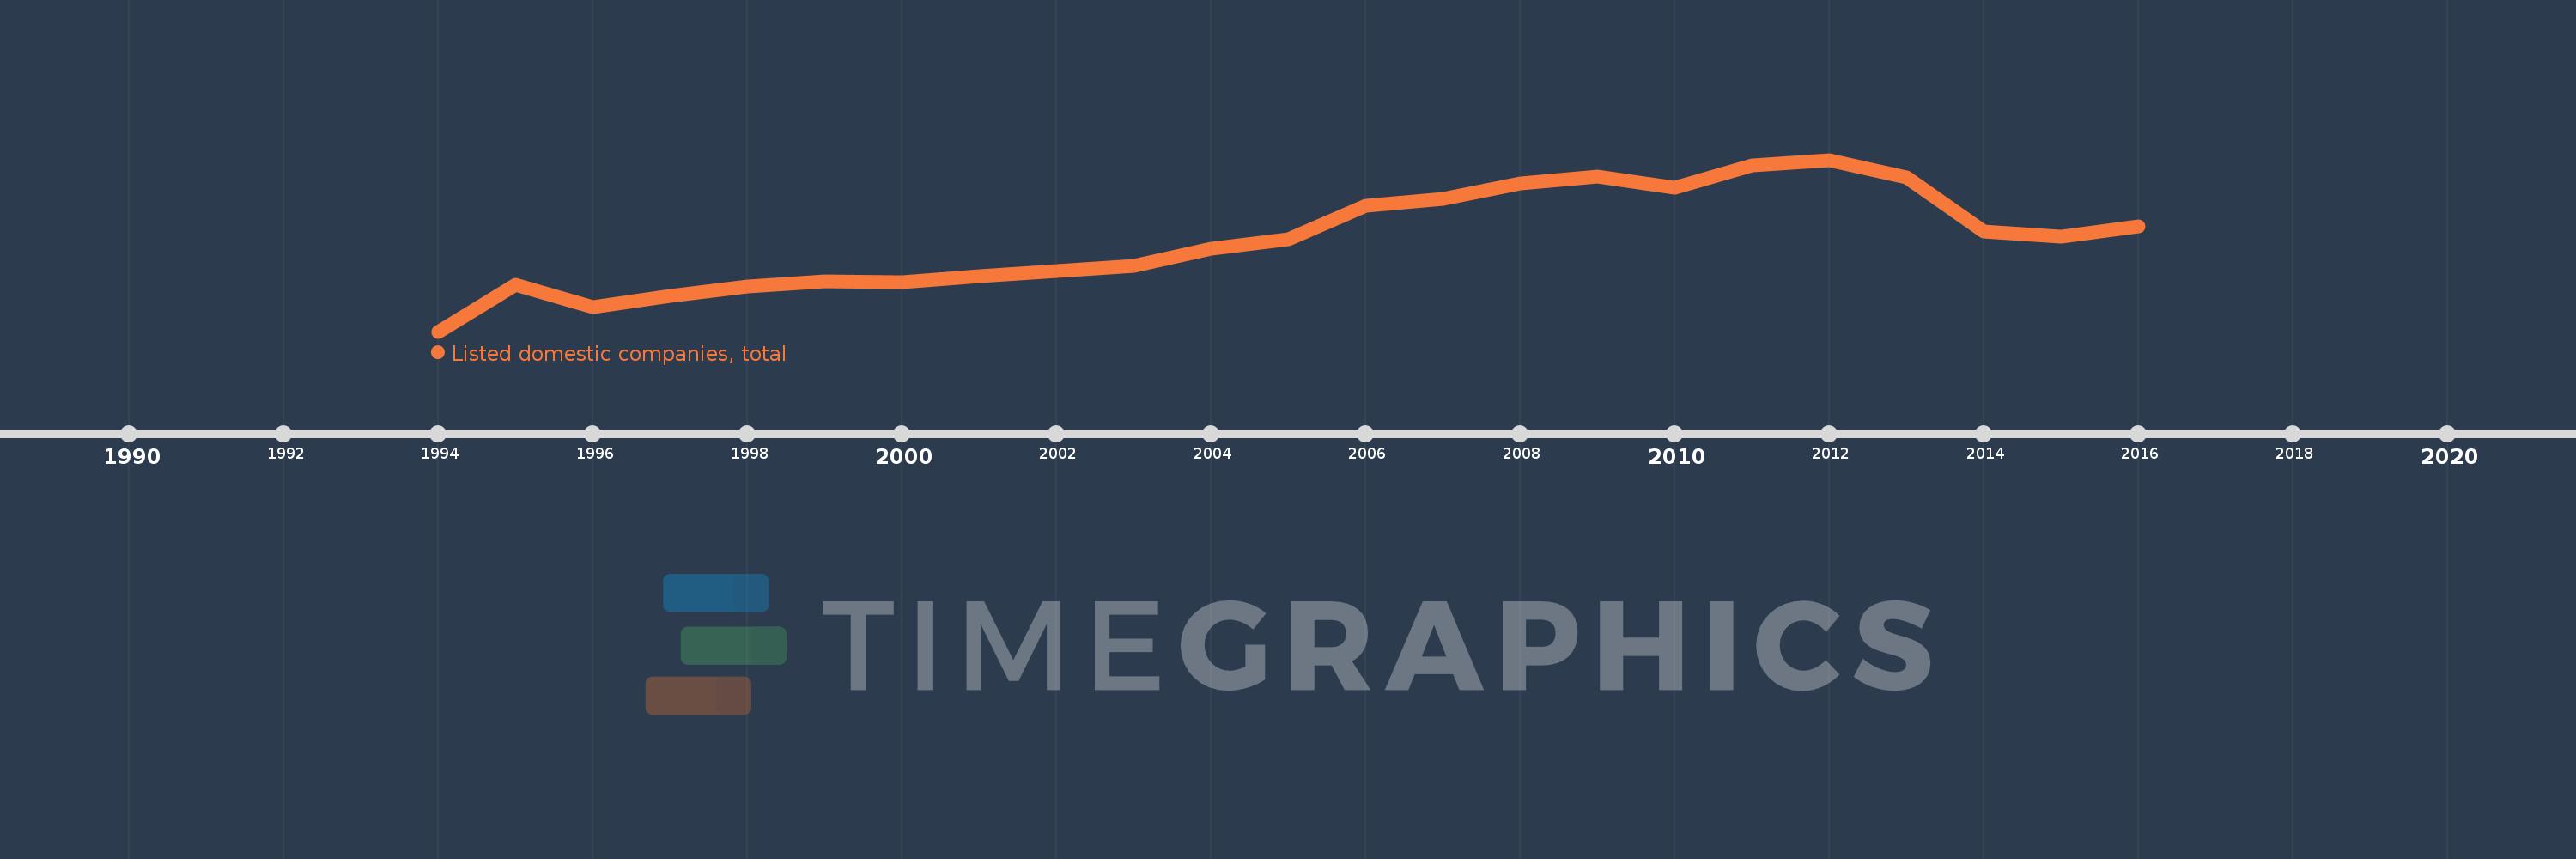
En esta escala de tiempo se presenta un gráfico de 1994 y 2016 de Upper middle income. Los datos de 1993 están ausentes. El número de observaciones reales por fecha: 23.

Fuente (nombre):

Indicadores del desarrollo mundial

Fuente (organización):

World Federation of Exchanges database.

Categorías:

Financial Sector

Se ha actualizado:

23 abr 2017 año

Los indicadores de los cambios de valor en los últimos años

En promedio:
6.676 mil
Mínimo:
3.571 mil
1 ene 1994 año
Máximo:
9.396 mil
1 ene 2012 año
A la fecha de observación
Valor
Cambio absoluto
El cambio con respecto al valor anterior
1 ene 1994 año
3.571 mil
+3.571 mil
0.0%
1 ene 1995 año
5.161 mil
+1.59 mil
44.53%
1 ene 1996 año
4.408 mil
-753.0
-14.59%
1 ene 1997 año
4.776 mil
+368.0
8.35%
1 ene 1998 año
5.106 mil
+330.0
6.91%
1 ene 1999 año
5.271 mil
+165.0
3.23%
1 ene 2000 año
5.252 mil
-19.0
-0.36%
1 ene 2001 año
5.442 mil
+190.0
3.62%
1 ene 2002 año
5.615 mil
+173.0
3.18%
1 ene 2003 año
5.795 mil
+180.0
3.21%
1 ene 2004 año
6.368 mil
+573.0
9.89%
1 ene 2005 año
6.714 mil
+346.0
5.43%
1 ene 2006 año
7.849 mil
+1.135 mil
16.9%
1 ene 2007 año
8.062 mil
+213.0
2.71%
1 ene 2008 año
8.6 mil
+538.0
6.67%
1 ene 2009 año
8.835 mil
+235.0
2.73%
1 ene 2010 año
8.435 mil
-400.0
-4.53%
1 ene 2011 año
9.219 mil
+784.0
9.29%
1 ene 2012 año
9.396 mil
+177.0
1.92%
1 ene 2013 año
8.809 mil
-587.0
-6.25%
1 ene 2014 año
6.951 mil
-1.858 mil
-21.09%
1 ene 2015 año
6.776 mil
-175.0
-2.52%
1 ene 2016 año
7.128 mil
+352.0
5.19%

Ranking de los países por los datos estadísticos actuales