29
/es/
es
AIzaSyAYiBZKx7MnpbEhh9jyipgxe19OcubqV5w
April 1, 2024
281222
Venezuela, RB
VEN
true
2
1
Listed domestic companies, total
2015,2014,2013,2012,2011,2010,2009,2008,2007,2006,2005,2004,2003,2002,2001,2000,1999,1998,1997,1996,1995,1994,1993,1992,1991
Download
Estadísticas Globales de la Biblioteca →Venezuela, RB →

Listed domestic companies, total

Estas estadísticas en otros países:
Arab WorldArgentinaArmeniaAustraliaAustriaAzerbaijanBahrainBangladeshBarbadosBelarusBelgiumBermudaBhutanBoliviaBosnia and HerzegovinaBotswanaBrazilBulgariaCanadaCayman IslandsCentral Europe and the BalticsChannel IslandsChileChinaColombiaCosta RicaCote d'IvoireCroatiaCyprusCzech RepublicDenmarkDominican RepublicEarly-demographic dividendEast Asia & PacificEast Asia & Pacific (excluding high income)East Asia & Pacific (IDA & IBRD countries)EcuadorEgypt, Arab Rep.El SalvadorEstoniaEuro areaEurope & Central AsiaEurope & Central Asia (excluding high income)Europe & Central Asia (IDA & IBRD countries)European UnionFijiFinlandFranceGeorgiaGermanyGhanaGreeceGuatemalaGuyanaHigh incomeHondurasHong Kong SAR, ChinaHungaryIBRD onlyIcelandIDA & IBRD totalIDA blendIDA totalIndiaIndonesiaIran, Islamic Rep.IrelandIsraelItalyJamaicaJapanJordanKazakhstanKenyaKorea, Dem. People’s Rep.Korea, Rep.KuwaitKyrgyz RepublicLate-demographic dividendLatin America & Caribbean Latin America & Caribbean (excluding high income)Latin America & the Caribbean (IDA & IBRD countries)LatviaLebanonLithuaniaLow & middle incomeLower middle incomeLuxembourgMacedonia, FYRMalawiMalaysiaMaltaMauritiusMexicoMiddle East & North AfricaMiddle East & North Africa (excluding high income)Middle East & North Africa (IDA & IBRD countries)Middle incomeMoldovaMongoliaMontenegroMoroccoNamibiaNepalNetherlandsNew ZealandNigeriaNorth AmericaNorwayOECD membersOmanOther small statesPakistanPanamaPapua New GuineaParaguayPeruPhilippinesPolandPortugalPost-demographic dividendQatarRomaniaRussian FederationSaudi ArabiaSerbiaSeychellesSingaporeSlovak RepublicSloveniaSouth AfricaSouth AsiaSouth Asia (IDA & IBRD)SpainSri LankaSt. Kitts and NevisSub-Saharan Africa Sub-Saharan Africa (excluding high income)Sub-Saharan Africa (IDA & IBRD countries)SwazilandSwedenSwitzerlandTanzaniaThailandTrinidad and TobagoTunisiaTurkeyUgandaUkraineUnited Arab EmiratesUnited KingdomUnited StatesUpper middle incomeUruguayUzbekistanVenezuela, RBVietnamWest Bank and GazaWorldZambiaZimbabwe
línea de tiempo (timeline):
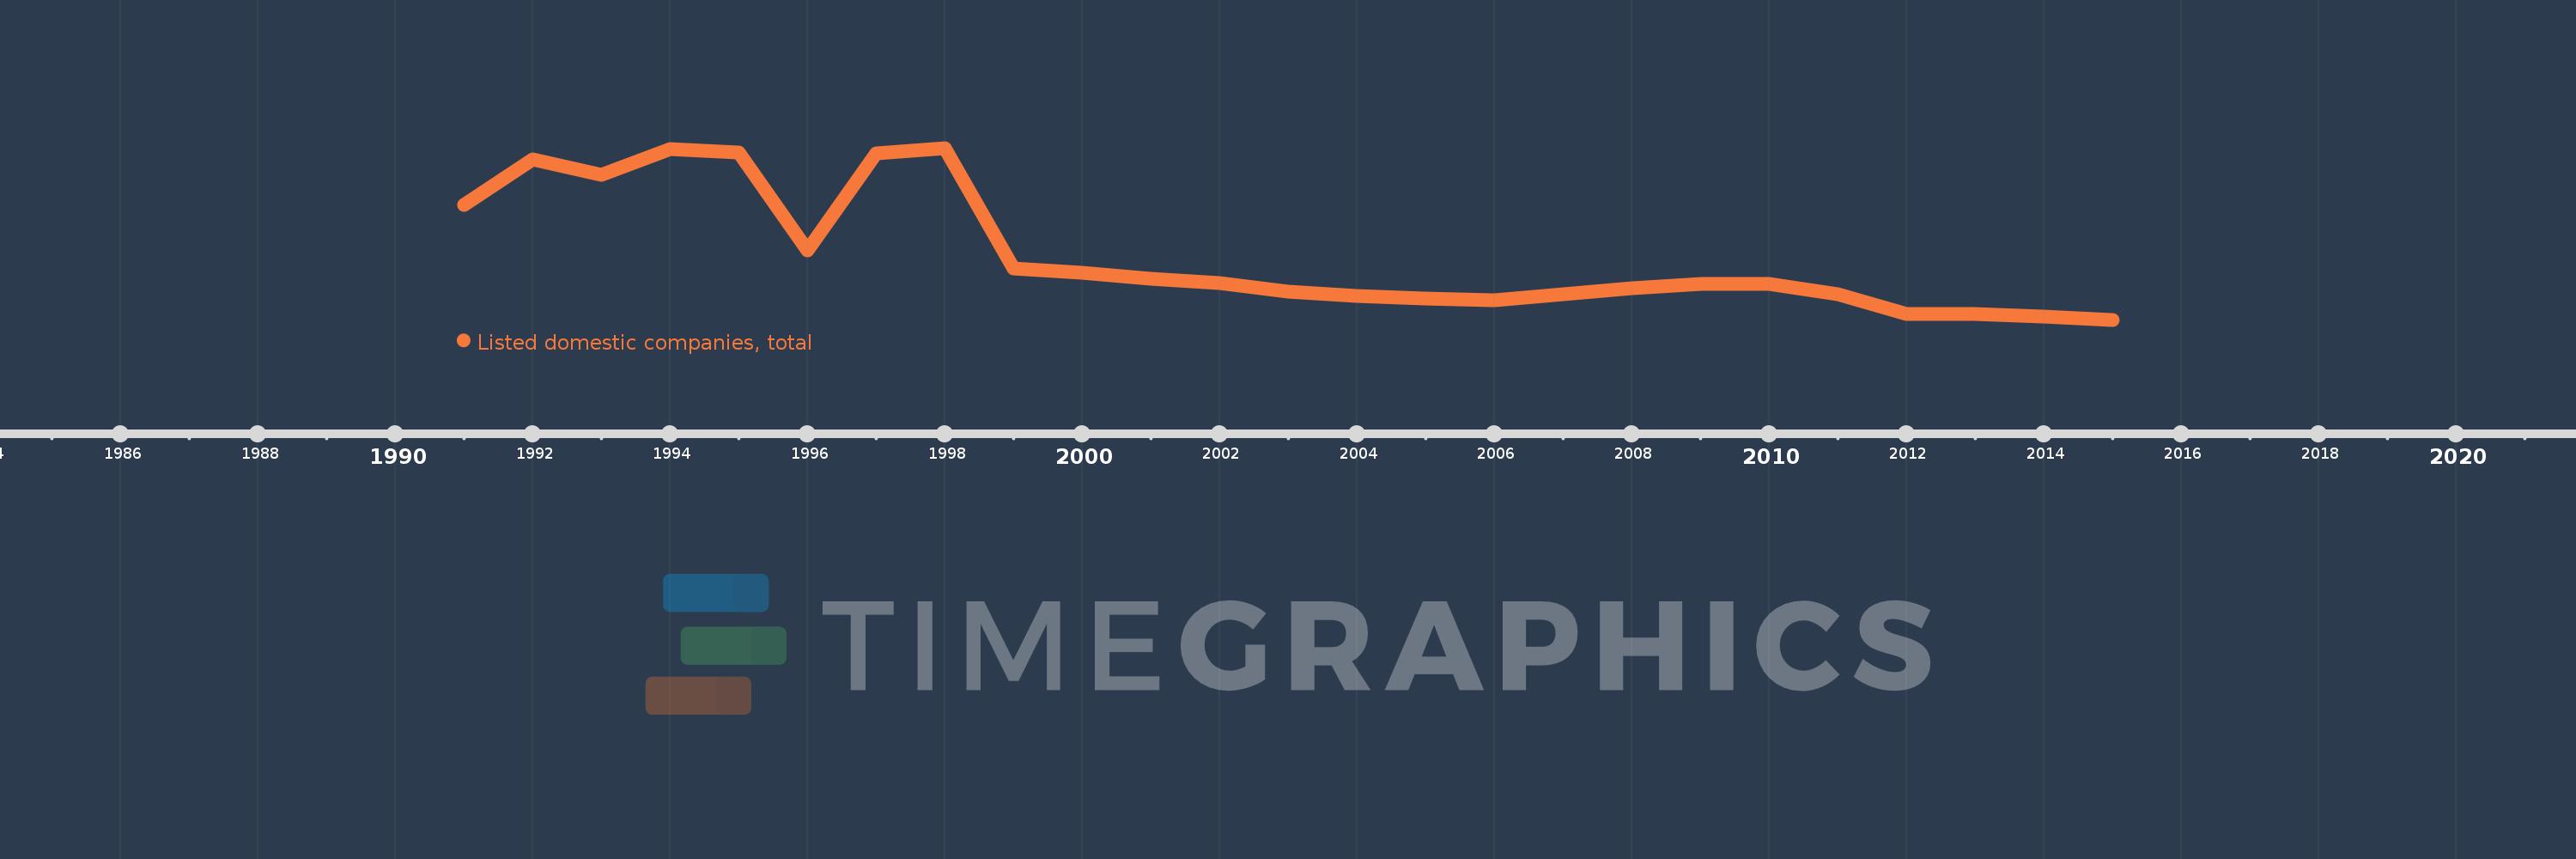
En esta escala de tiempo se presenta un gráfico de 1991 y 2015 de Venezuela, RB. Los datos de 1990 están ausentes. El número de observaciones reales por fecha: 25.
Fuente (nombre):
Indicadores del desarrollo mundial
Fuente (organización):
World Federation of Exchanges database.
Categorías:
Financial Sector
Se ha actualizado:
23 abr 2017 año
Los indicadores de los cambios de valor en los últimos años
En promedio:
82.16
Mínimo:
37.0
1 ene 2015 año
Máximo:
158.0
1 ene 1998 año
A la fecha de observación
Valor
Cambio absoluto
El cambio con respecto al valor anterior
1 ene 1991 año
118.0
+118.0
0.0%
1 ene 1992 año
150.0
+32.0
27.12%
1 ene 1993 año
139.0
-11.0
-7.33%
1 ene 1994 año
157.0
+18.0
12.95%
1 ene 1995 año
155.0
-2.0
-1.27%
1 ene 1996 año
86.0
-69.0
-44.52%
1 ene 1997 año
154.0
+68.0
79.07%
1 ene 1998 año
158.0
+4.0
2.6%
1 ene 1999 año
73.0
-85.0
-53.8%
1 ene 2000 año
70.0
-3.0
-4.11%
1 ene 2001 año
66.0
-4.0
-5.71%
1 ene 2002 año
63.0
-3.0
-4.55%
1 ene 2003 año
57.0
-6.0
-9.52%
1 ene 2004 año
54.0
-3.0
-5.26%
1 ene 2005 año
52.0
-2.0
-3.7%
1 ene 2006 año
51.0
-1.0
-1.92%
1 ene 2007 año
55.0
+4.0
7.84%
1 ene 2008 año
59.0
+4.0
7.27%
1 ene 2009 año
62.0
+3.0
5.08%
1 ene 2010 año
62.0
0.0
0.0%
1 ene 2011 año
55.0
-7.0
-11.29%
1 ene 2012 año
41.0
-14.0
-25.45%
1 ene 2013 año
41.0
0.0
0.0%
1 ene 2014 año
39.0
-2.0
-4.88%
1 ene 2015 año
37.0
-2.0
-5.13%
Ranking de los países por los datos estadísticos actuales

Comentarios:

Enviar
PremiumAbout & FeedbackAcuerdoPrivacidad
logo
© 2022 Selected Technologies LLC – Morgan Hill, California