33
/es/
AIzaSyAYiBZKx7MnpbEhh9jyipgxe19OcubqV5w
May 1, 2025
47308
Lower middle income
LMC
false
2
1
Listed domestic companies, total
2016,2015,2014,2013,2012,2011,2010,2009,2008,2007,2006,2005,2004,2003,2002,2001,2000,1999,1998,1997,1996,1995,1994
Download
Estadísticas Globales de la Biblioteca →Lower middle income →

Listed domestic companies, total

Estas estadísticas en otros países:

Arab WorldArgentinaArmeniaAustraliaAustriaAzerbaijanBahrainBangladeshBarbadosBelarusBelgiumBermudaBhutanBoliviaBosnia and HerzegovinaBotswanaBrazilBulgariaCanadaCayman IslandsCentral Europe and the BalticsChannel IslandsChileChinaColombiaCosta RicaCote d'IvoireCroatiaCyprusCzech RepublicDenmarkDominican RepublicEarly-demographic dividendEast Asia & PacificEast Asia & Pacific (excluding high income)East Asia & Pacific (IDA & IBRD countries)EcuadorEgypt, Arab Rep.El SalvadorEstoniaEuro areaEurope & Central AsiaEurope & Central Asia (excluding high income)Europe & Central Asia (IDA & IBRD countries)European UnionFijiFinlandFranceGeorgiaGermanyGhanaGreeceGuatemalaGuyanaHigh incomeHondurasHong Kong SAR, ChinaHungaryIBRD onlyIcelandIDA & IBRD totalIDA blendIDA totalIndiaIndonesiaIran, Islamic Rep.IrelandIsraelItalyJamaicaJapanJordanKazakhstanKenyaKorea, Dem. People’s Rep.Korea, Rep.KuwaitKyrgyz RepublicLate-demographic dividendLatin America & Caribbean Latin America & Caribbean (excluding high income)Latin America & the Caribbean (IDA & IBRD countries)LatviaLebanonLithuaniaLow & middle incomeLower middle incomeLuxembourgMacedonia, FYRMalawiMalaysiaMaltaMauritiusMexicoMiddle East & North AfricaMiddle East & North Africa (excluding high income)Middle East & North Africa (IDA & IBRD countries)Middle incomeMoldovaMongoliaMontenegroMoroccoNamibiaNepalNetherlandsNew ZealandNigeriaNorth AmericaNorwayOECD membersOmanOther small statesPakistanPanamaPapua New GuineaParaguayPeruPhilippinesPolandPortugalPost-demographic dividendQatarRomaniaRussian FederationSaudi ArabiaSerbiaSeychellesSingaporeSlovak RepublicSloveniaSouth AfricaSouth AsiaSouth Asia (IDA & IBRD)SpainSri LankaSt. Kitts and NevisSub-Saharan Africa Sub-Saharan Africa (excluding high income)Sub-Saharan Africa (IDA & IBRD countries)SwazilandSwedenSwitzerlandTanzaniaThailandTrinidad and TobagoTunisiaTurkeyUgandaUkraineUnited Arab EmiratesUnited KingdomUnited StatesUpper middle incomeUruguayUzbekistanVenezuela, RBVietnamWest Bank and GazaWorldZambiaZimbabwe

línea de tiempo (timeline):

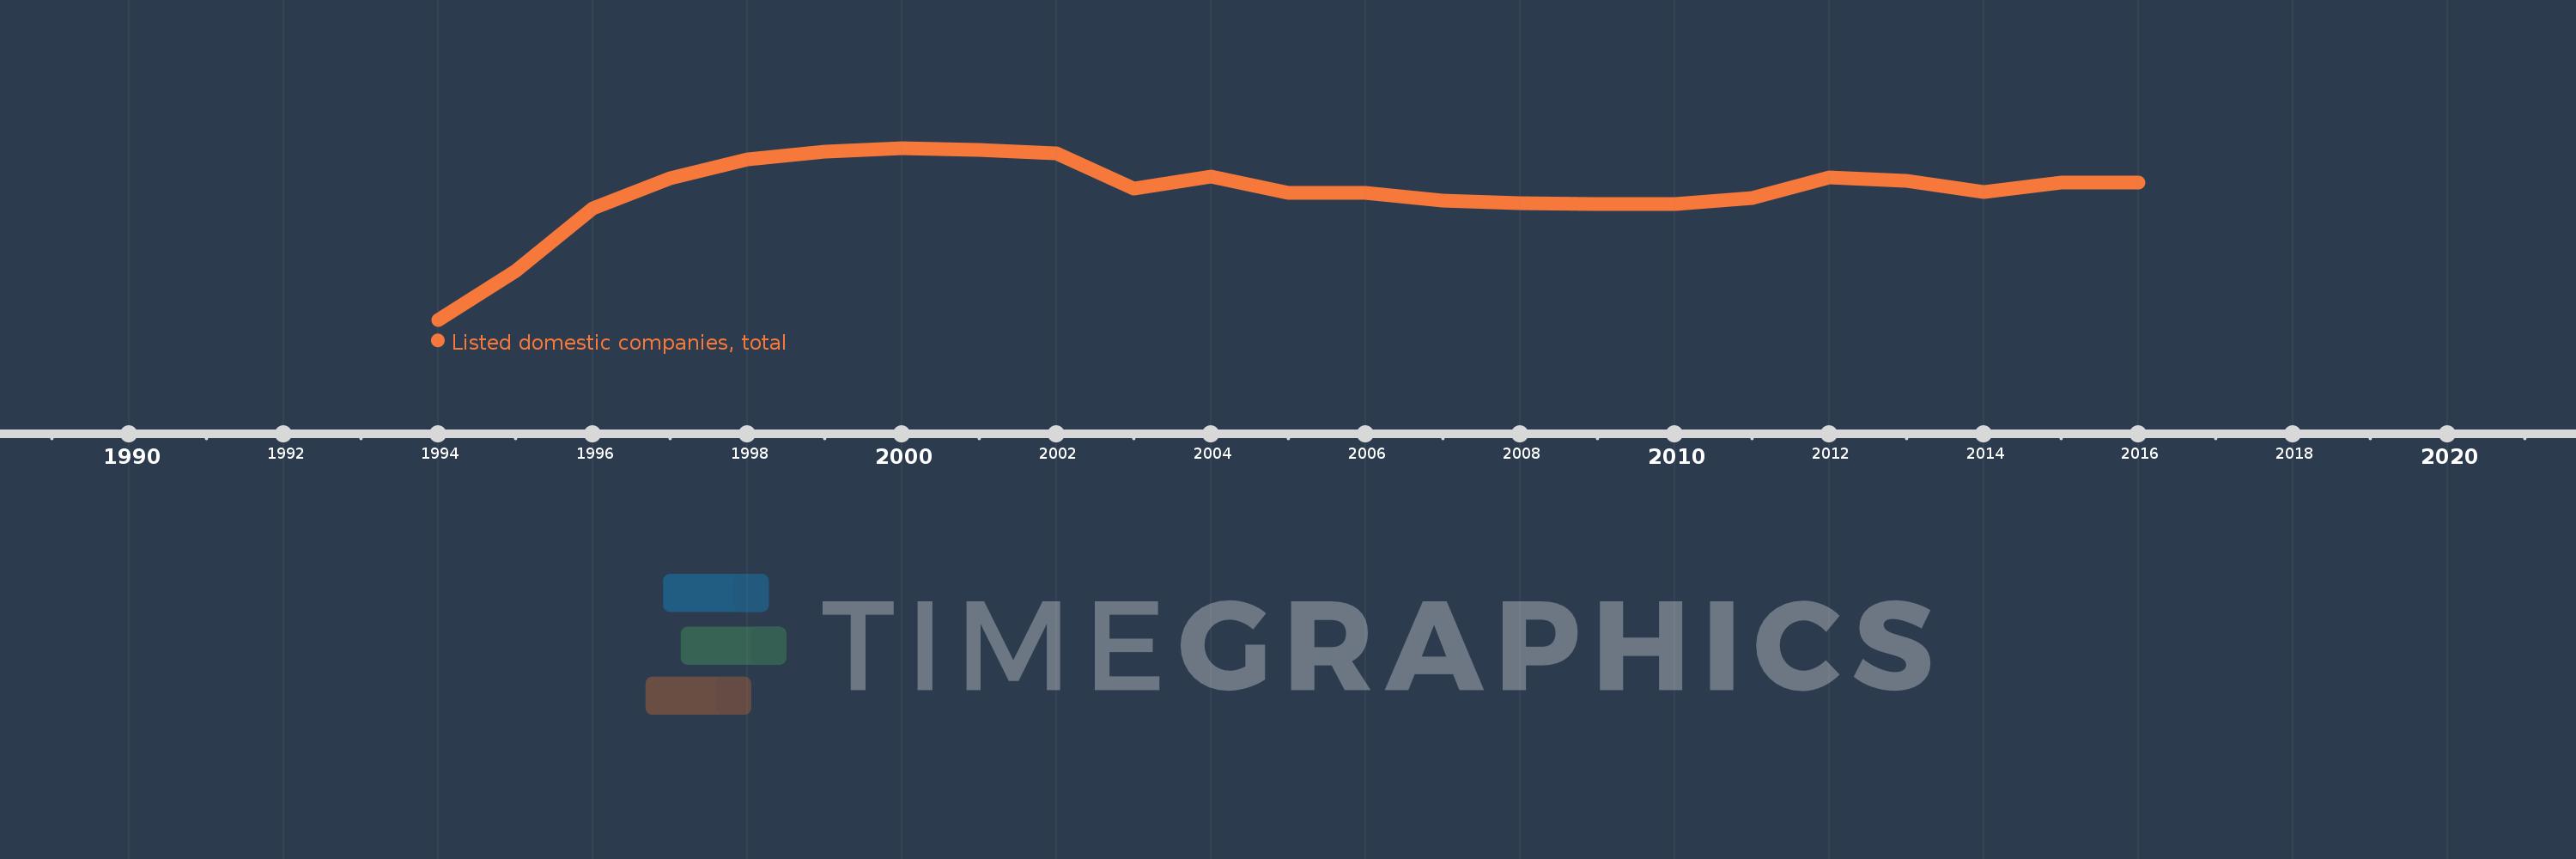
En esta escala de tiempo se presenta un gráfico de 1994 y 2016 de Lower middle income. Los datos de 1993 están ausentes. El número de observaciones reales por fecha: 23.

Fuente (nombre):

Indicadores del desarrollo mundial

Fuente (organización):

World Federation of Exchanges database.

Categorías:

Financial Sector

Se ha actualizado:

23 abr 2017 año

Los indicadores de los cambios de valor en los últimos años

En promedio:
8.402 mil
Mínimo:
4.927 mil
1 ene 1994 año
Máximo:
9.603 mil
1 ene 2000 año
A la fecha de observación
Valor
Cambio absoluto
El cambio con respecto al valor anterior
1 ene 1994 año
4.927 mil
+4.927 mil
0.0%
1 ene 1995 año
6.258 mil
+1.331 mil
27.01%
1 ene 1996 año
7.953 mil
+1.695 mil
27.09%
1 ene 1997 año
8.772 mil
+819.0
10.3%
1 ene 1998 año
9.286 mil
+514.0
5.86%
1 ene 1999 año
9.508 mil
+222.0
2.39%
1 ene 2000 año
9.603 mil
+95.0
1.0%
1 ene 2001 año
9.548 mil
-55.0
-0.57%
1 ene 2002 año
9.446 mil
-102.0
-1.07%
1 ene 2003 año
8.49 mil
-956.0
-10.12%
1 ene 2004 año
8.821 mil
+331.0
3.9%
1 ene 2005 año
8.383 mil
-438.0
-4.97%
1 ene 2006 año
8.372 mil
-11.0
-0.13%
1 ene 2007 año
8.161 mil
-211.0
-2.52%
1 ene 2008 año
8.103 mil
-58.0
-0.71%
1 ene 2009 año
8.072 mil
-31.0
-0.38%
1 ene 2010 año
8.082 mil
+10.0
0.12%
1 ene 2011 año
8.233 mil
+151.0
1.87%
1 ene 2012 año
8.8 mil
+567.0
6.89%
1 ene 2013 año
8.7 mil
-100.0
-1.14%
1 ene 2014 año
8.407 mil
-293.0
-3.37%
1 ene 2015 año
8.651 mil
+244.0
2.9%
1 ene 2016 año
8.663 mil
+12.0
0.14%

Ranking de los países por los datos estadísticos actuales