33
/es/
AIzaSyAYiBZKx7MnpbEhh9jyipgxe19OcubqV5w
August 1, 2025
166385
Kazakhstan
KAZ
true
2
1
Listed domestic companies, total
2016,2015,2014,2013,2012,2011,2010,2009,2008,2007,2006,2005,2004,2003,1999,1998
Download
Estadísticas Globales de la Biblioteca →Kazakhstan →

Listed domestic companies, total

Estas estadísticas en otros países:

Arab WorldArgentinaArmeniaAustraliaAustriaAzerbaijanBahrainBangladeshBarbadosBelarusBelgiumBermudaBhutanBoliviaBosnia and HerzegovinaBotswanaBrazilBulgariaCanadaCayman IslandsCentral Europe and the BalticsChannel IslandsChileChinaColombiaCosta RicaCote d'IvoireCroatiaCyprusCzech RepublicDenmarkDominican RepublicEarly-demographic dividendEast Asia & PacificEast Asia & Pacific (excluding high income)East Asia & Pacific (IDA & IBRD countries)EcuadorEgypt, Arab Rep.El SalvadorEstoniaEuro areaEurope & Central AsiaEurope & Central Asia (excluding high income)Europe & Central Asia (IDA & IBRD countries)European UnionFijiFinlandFranceGeorgiaGermanyGhanaGreeceGuatemalaGuyanaHigh incomeHondurasHong Kong SAR, ChinaHungaryIBRD onlyIcelandIDA & IBRD totalIDA blendIDA totalIndiaIndonesiaIran, Islamic Rep.IrelandIsraelItalyJamaicaJapanJordanKazakhstanKenyaKorea, Dem. People’s Rep.Korea, Rep.KuwaitKyrgyz RepublicLate-demographic dividendLatin America & Caribbean Latin America & Caribbean (excluding high income)Latin America & the Caribbean (IDA & IBRD countries)LatviaLebanonLithuaniaLow & middle incomeLower middle incomeLuxembourgMacedonia, FYRMalawiMalaysiaMaltaMauritiusMexicoMiddle East & North AfricaMiddle East & North Africa (excluding high income)Middle East & North Africa (IDA & IBRD countries)Middle incomeMoldovaMongoliaMontenegroMoroccoNamibiaNepalNetherlandsNew ZealandNigeriaNorth AmericaNorwayOECD membersOmanOther small statesPakistanPanamaPapua New GuineaParaguayPeruPhilippinesPolandPortugalPost-demographic dividendQatarRomaniaRussian FederationSaudi ArabiaSerbiaSeychellesSingaporeSlovak RepublicSloveniaSouth AfricaSouth AsiaSouth Asia (IDA & IBRD)SpainSri LankaSt. Kitts and NevisSub-Saharan Africa Sub-Saharan Africa (excluding high income)Sub-Saharan Africa (IDA & IBRD countries)SwazilandSwedenSwitzerlandTanzaniaThailandTrinidad and TobagoTunisiaTurkeyUgandaUkraineUnited Arab EmiratesUnited KingdomUnited StatesUpper middle incomeUruguayUzbekistanVenezuela, RBVietnamWest Bank and GazaWorldZambiaZimbabwe

línea de tiempo (timeline):

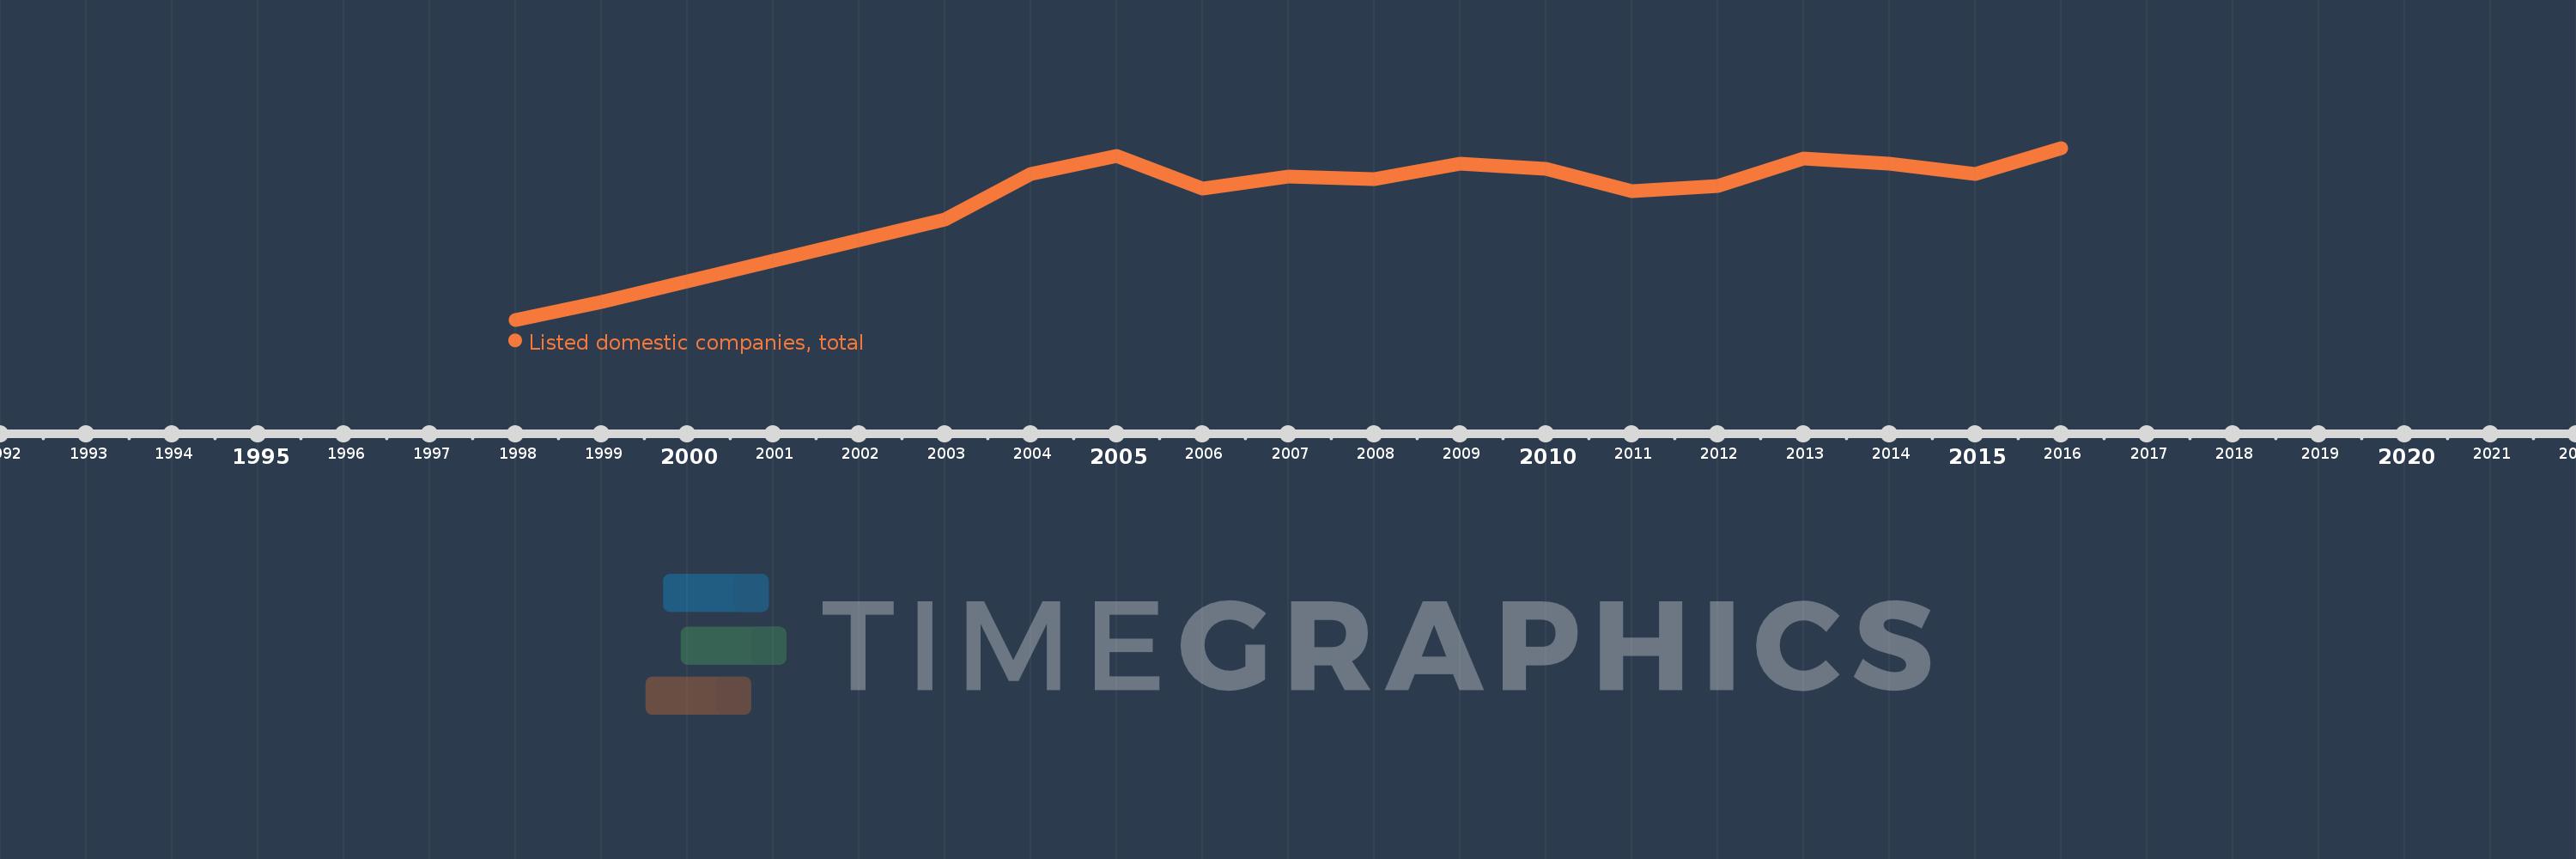
En esta escala de tiempo se presenta un gráfico de 1998 y 2016 de Kazakhstan. Los datos de 1997 están ausentes. El número de observaciones reales por fecha: 16.

Fuente (nombre):

Indicadores del desarrollo mundial

Fuente (organización):

World Federation of Exchanges database.

Categorías:

Financial Sector

Se ha actualizado:

23 abr 2017 año

Los indicadores de los cambios de valor en los últimos años

En promedio:
60.938
Mínimo:
11.0
1 ene 1998 año
Máximo:
78.0
1 ene 2016 año
A la fecha de observación
Valor
Cambio absoluto
El cambio con respecto al valor anterior
1 ene 1998 año
11.0
+11.0
0.0%
1 ene 1999 año
18.0
+7.0
63.64%
1 ene 2003 año
50.0
+32.0
177.78%
1 ene 2004 año
68.0
+18.0
36.0%
1 ene 2005 año
75.0
+7.0
10.29%
1 ene 2006 año
62.0
-13.0
-17.33%
1 ene 2007 año
67.0
+5.0
8.06%
1 ene 2008 año
66.0
-1.0
-1.49%
1 ene 2009 año
72.0
+6.0
9.09%
1 ene 2010 año
70.0
-2.0
-2.78%
1 ene 2011 año
61.0
-9.0
-12.86%
1 ene 2012 año
63.0
+2.0
3.28%
1 ene 2013 año
74.0
+11.0
17.46%
1 ene 2014 año
72.0
-2.0
-2.7%
1 ene 2015 año
68.0
-4.0
-5.56%
1 ene 2016 año
78.0
+10.0
14.71%

Ranking de los países por los datos estadísticos actuales