33
/es/
AIzaSyAYiBZKx7MnpbEhh9jyipgxe19OcubqV5w
August 1, 2025
133356
Finland
FIN
true
2
1
Listed domestic companies, total
2005,2004,2003,2002,2001,2000,1999,1998,1997,1996,1995,1994,1993,1992,1991,1990,1989,1988,1987,1986,1985,1984
Download
Estadísticas Globales de la Biblioteca →Finland →

Listed domestic companies, total

Estas estadísticas en otros países:

Arab WorldArgentinaArmeniaAustraliaAustriaAzerbaijanBahrainBangladeshBarbadosBelarusBelgiumBermudaBhutanBoliviaBosnia and HerzegovinaBotswanaBrazilBulgariaCanadaCayman IslandsCentral Europe and the BalticsChannel IslandsChileChinaColombiaCosta RicaCote d'IvoireCroatiaCyprusCzech RepublicDenmarkDominican RepublicEarly-demographic dividendEast Asia & PacificEast Asia & Pacific (excluding high income)East Asia & Pacific (IDA & IBRD countries)EcuadorEgypt, Arab Rep.El SalvadorEstoniaEuro areaEurope & Central AsiaEurope & Central Asia (excluding high income)Europe & Central Asia (IDA & IBRD countries)European UnionFijiFinlandFranceGeorgiaGermanyGhanaGreeceGuatemalaGuyanaHigh incomeHondurasHong Kong SAR, ChinaHungaryIBRD onlyIcelandIDA & IBRD totalIDA blendIDA totalIndiaIndonesiaIran, Islamic Rep.IrelandIsraelItalyJamaicaJapanJordanKazakhstanKenyaKorea, Dem. People’s Rep.Korea, Rep.KuwaitKyrgyz RepublicLate-demographic dividendLatin America & Caribbean Latin America & Caribbean (excluding high income)Latin America & the Caribbean (IDA & IBRD countries)LatviaLebanonLithuaniaLow & middle incomeLower middle incomeLuxembourgMacedonia, FYRMalawiMalaysiaMaltaMauritiusMexicoMiddle East & North AfricaMiddle East & North Africa (excluding high income)Middle East & North Africa (IDA & IBRD countries)Middle incomeMoldovaMongoliaMontenegroMoroccoNamibiaNepalNetherlandsNew ZealandNigeriaNorth AmericaNorwayOECD membersOmanOther small statesPakistanPanamaPapua New GuineaParaguayPeruPhilippinesPolandPortugalPost-demographic dividendQatarRomaniaRussian FederationSaudi ArabiaSerbiaSeychellesSingaporeSlovak RepublicSloveniaSouth AfricaSouth AsiaSouth Asia (IDA & IBRD)SpainSri LankaSt. Kitts and NevisSub-Saharan Africa Sub-Saharan Africa (excluding high income)Sub-Saharan Africa (IDA & IBRD countries)SwazilandSwedenSwitzerlandTanzaniaThailandTrinidad and TobagoTunisiaTurkeyUgandaUkraineUnited Arab EmiratesUnited KingdomUnited StatesUpper middle incomeUruguayUzbekistanVenezuela, RBVietnamWest Bank and GazaWorldZambiaZimbabwe

línea de tiempo (timeline):

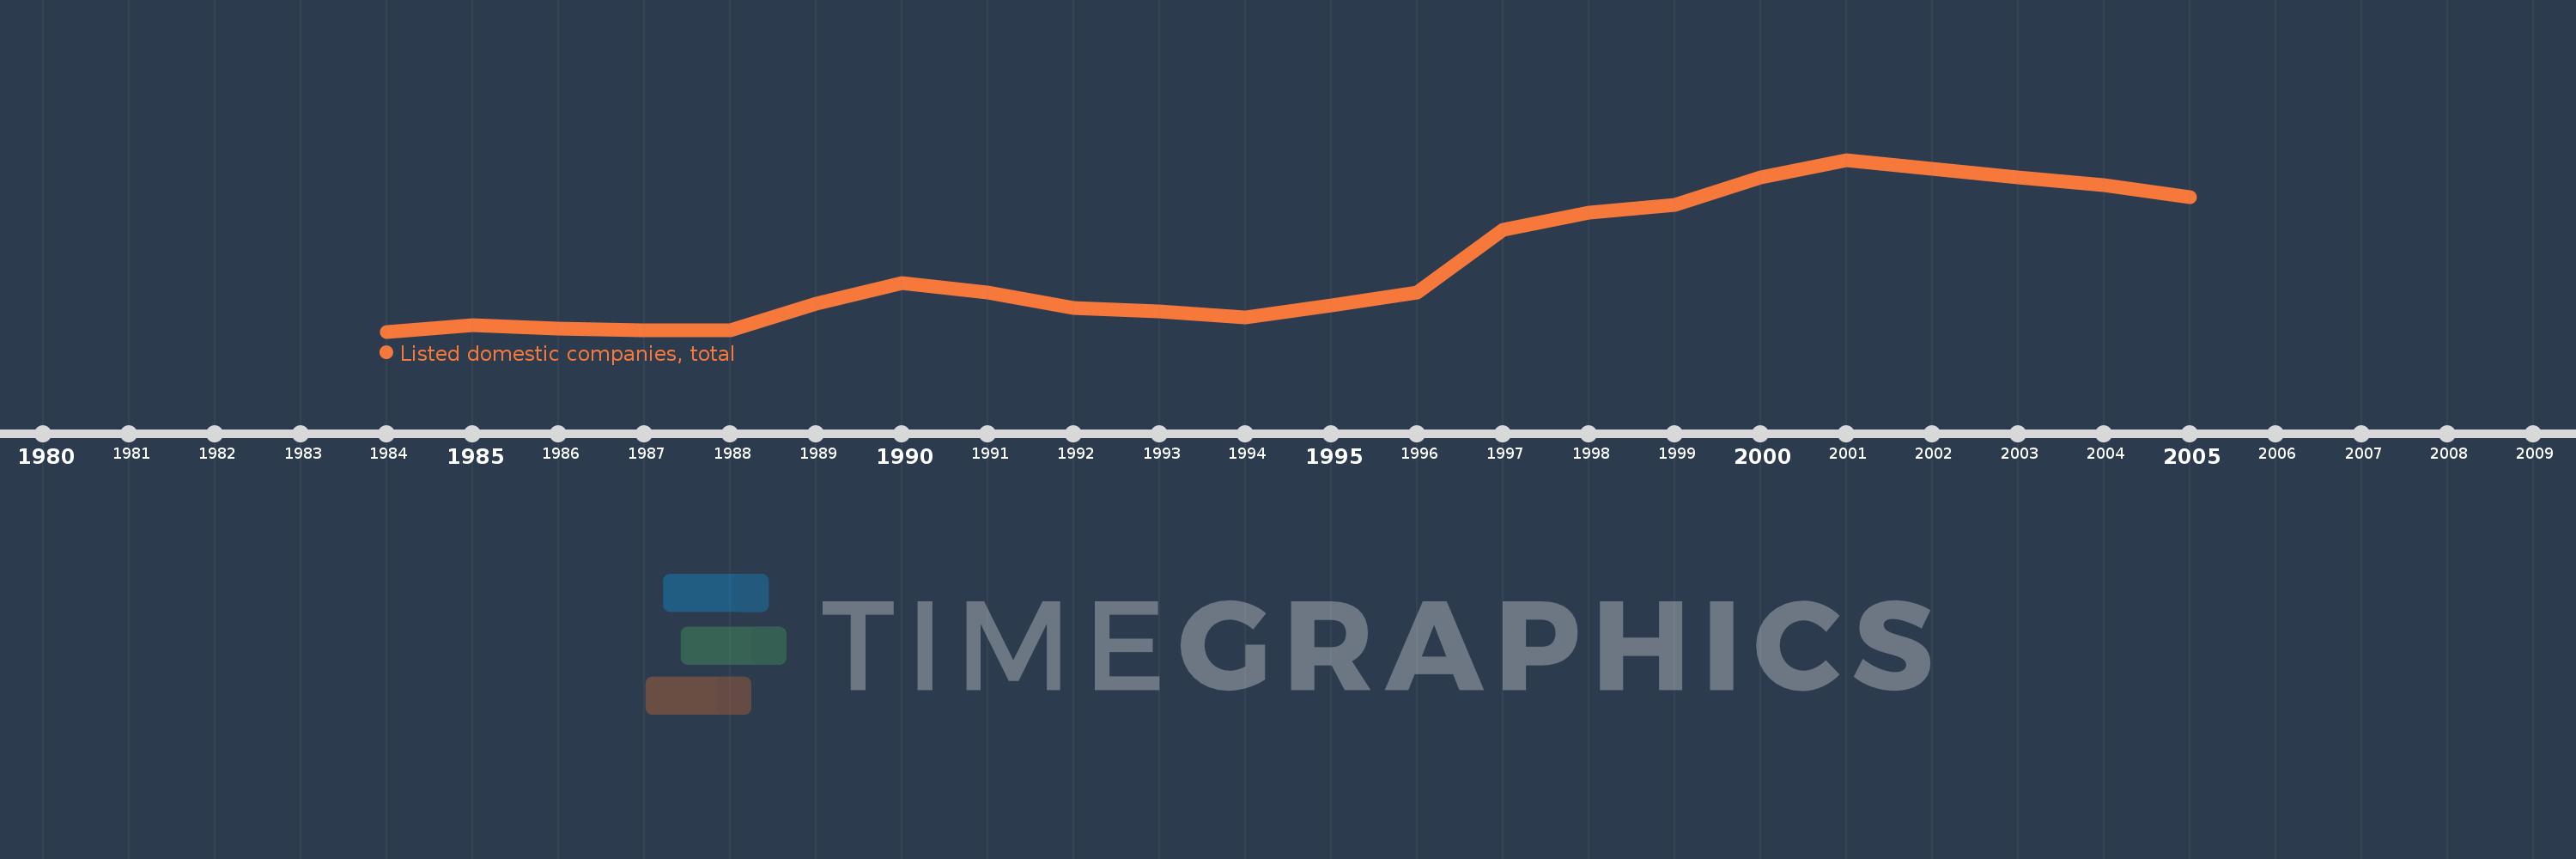
En esta escala de tiempo se presenta un gráfico de 1984 y 2005 de Finland. Los datos de 1983 están ausentes. El número de observaciones reales por fecha: 22.

Fuente (nombre):

Indicadores del desarrollo mundial

Fuente (organización):

World Federation of Exchanges database.

Categorías:

Financial Sector

Se ha actualizado:

23 abr 2017 año

Los indicadores de los cambios de valor en los últimos años

En promedio:
92.318
Mínimo:
48.0
1 ene 1984 año
Máximo:
158.0
1 ene 2001 año
A la fecha de observación
Valor
Cambio absoluto
El cambio con respecto al valor anterior
1 ene 1984 año
48.0
+48.0
0.0%
1 ene 1985 año
52.0
+4.0
8.33%
1 ene 1986 año
50.0
-2.0
-3.85%
1 ene 1987 año
49.0
-1.0
-2.0%
1 ene 1988 año
49.0
0.0
0.0%
1 ene 1989 año
66.0
+17.0
34.69%
1 ene 1990 año
79.0
+13.0
19.7%
1 ene 1991 año
73.0
-6.0
-7.59%
1 ene 1992 año
63.0
-10.0
-13.7%
1 ene 1993 año
61.0
-2.0
-3.17%
1 ene 1994 año
57.0
-4.0
-6.56%
1 ene 1995 año
65.0
+8.0
14.04%
1 ene 1996 año
73.0
+8.0
12.31%
1 ene 1997 año
113.0
+40.0
54.79%
1 ene 1998 año
124.0
+11.0
9.73%
1 ene 1999 año
129.0
+5.0
4.03%
1 ene 2000 año
147.0
+18.0
13.95%
1 ene 2001 año
158.0
+11.0
7.48%
1 ene 2002 año
152.0
-6.0
-3.8%
1 ene 2003 año
147.0
-5.0
-3.29%
1 ene 2004 año
142.0
-5.0
-3.4%
1 ene 2005 año
134.0
-8.0
-5.63%

Ranking de los países por los datos estadísticos actuales