33
/es/
AIzaSyAYiBZKx7MnpbEhh9jyipgxe19OcubqV5w
August 1, 2025
107495
Colombia
COL
true
2
1
Listed domestic companies, total
2016,2015,2014,2013,2012,2011,2010,2009,2008,2007,2006,2005,2004,2003,2002,2001,2000,1999,1998,1997,1996,1995,1994,1993,1992,1991
Download
Estadísticas Globales de la Biblioteca →Colombia →

Listed domestic companies, total

Estas estadísticas en otros países:

Arab WorldArgentinaArmeniaAustraliaAustriaAzerbaijanBahrainBangladeshBarbadosBelarusBelgiumBermudaBhutanBoliviaBosnia and HerzegovinaBotswanaBrazilBulgariaCanadaCayman IslandsCentral Europe and the BalticsChannel IslandsChileChinaColombiaCosta RicaCote d'IvoireCroatiaCyprusCzech RepublicDenmarkDominican RepublicEarly-demographic dividendEast Asia & PacificEast Asia & Pacific (excluding high income)East Asia & Pacific (IDA & IBRD countries)EcuadorEgypt, Arab Rep.El SalvadorEstoniaEuro areaEurope & Central AsiaEurope & Central Asia (excluding high income)Europe & Central Asia (IDA & IBRD countries)European UnionFijiFinlandFranceGeorgiaGermanyGhanaGreeceGuatemalaGuyanaHigh incomeHondurasHong Kong SAR, ChinaHungaryIBRD onlyIcelandIDA & IBRD totalIDA blendIDA totalIndiaIndonesiaIran, Islamic Rep.IrelandIsraelItalyJamaicaJapanJordanKazakhstanKenyaKorea, Dem. People’s Rep.Korea, Rep.KuwaitKyrgyz RepublicLate-demographic dividendLatin America & Caribbean Latin America & Caribbean (excluding high income)Latin America & the Caribbean (IDA & IBRD countries)LatviaLebanonLithuaniaLow & middle incomeLower middle incomeLuxembourgMacedonia, FYRMalawiMalaysiaMaltaMauritiusMexicoMiddle East & North AfricaMiddle East & North Africa (excluding high income)Middle East & North Africa (IDA & IBRD countries)Middle incomeMoldovaMongoliaMontenegroMoroccoNamibiaNepalNetherlandsNew ZealandNigeriaNorth AmericaNorwayOECD membersOmanOther small statesPakistanPanamaPapua New GuineaParaguayPeruPhilippinesPolandPortugalPost-demographic dividendQatarRomaniaRussian FederationSaudi ArabiaSerbiaSeychellesSingaporeSlovak RepublicSloveniaSouth AfricaSouth AsiaSouth Asia (IDA & IBRD)SpainSri LankaSt. Kitts and NevisSub-Saharan Africa Sub-Saharan Africa (excluding high income)Sub-Saharan Africa (IDA & IBRD countries)SwazilandSwedenSwitzerlandTanzaniaThailandTrinidad and TobagoTunisiaTurkeyUgandaUkraineUnited Arab EmiratesUnited KingdomUnited StatesUpper middle incomeUruguayUzbekistanVenezuela, RBVietnamWest Bank and GazaWorldZambiaZimbabwe

línea de tiempo (timeline):

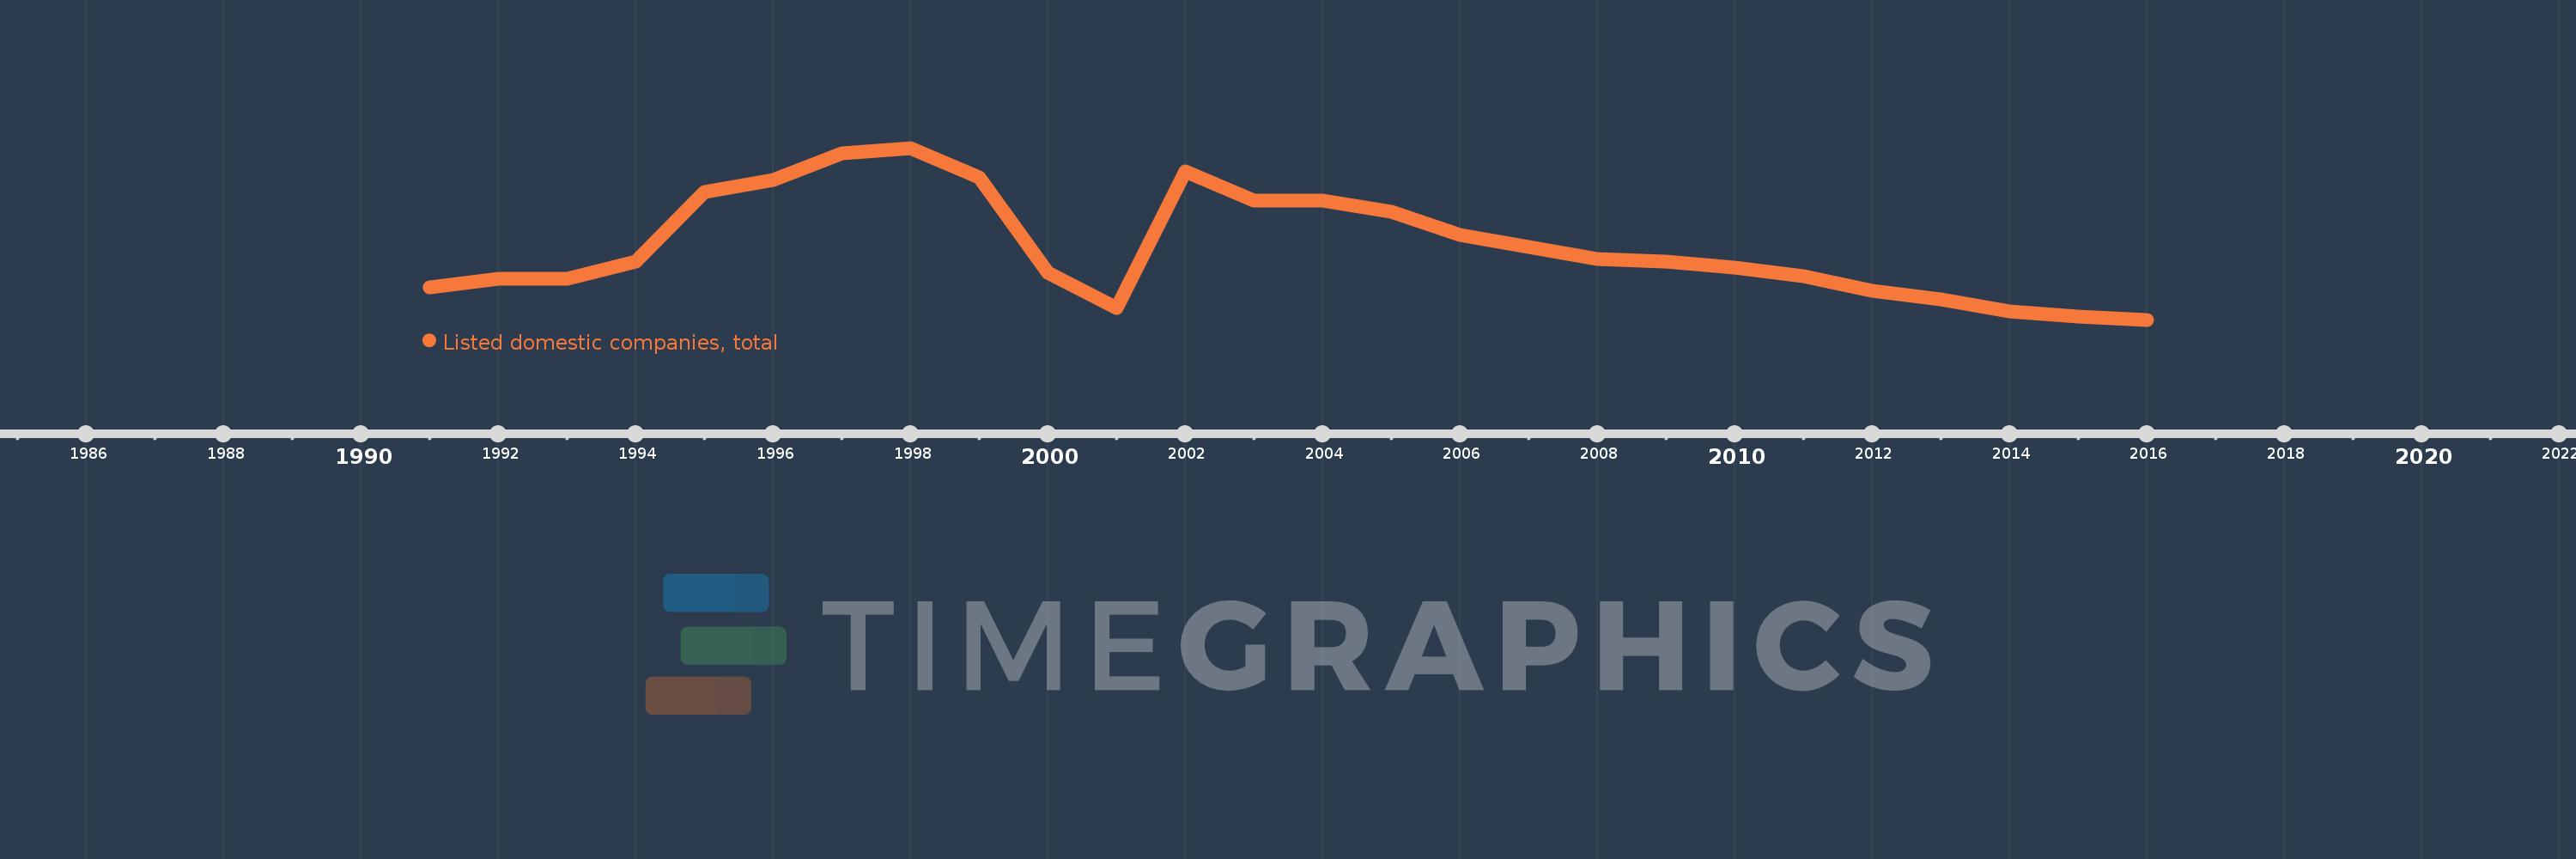
En esta escala de tiempo se presenta un gráfico de 1991 y 2016 de Colombia. Los datos de 1990 están ausentes. El número de observaciones reales por fecha: 26.

Fuente (nombre):

Indicadores del desarrollo mundial

Fuente (organización):

World Federation of Exchanges database.

Categorías:

Financial Sector

Se ha actualizado:

23 abr 2017 año

Los indicadores de los cambios de valor en los últimos años

En promedio:
94.192
Mínimo:
69.0
1 ene 2016 año
Máximo:
128.0
1 ene 1998 año
A la fecha de observación
Valor
Cambio absoluto
El cambio con respecto al valor anterior
1 ene 1991 año
80.0
+80.0
0.0%
1 ene 1992 año
83.0
+3.0
3.75%
1 ene 1993 año
83.0
0.0
0.0%
1 ene 1994 año
89.0
+6.0
7.23%
1 ene 1995 año
113.0
+24.0
26.97%
1 ene 1996 año
117.0
+4.0
3.54%
1 ene 1997 año
126.0
+9.0
7.69%
1 ene 1998 año
128.0
+2.0
1.59%
1 ene 1999 año
118.0
-10.0
-7.81%
1 ene 2000 año
85.0
-33.0
-27.97%
1 ene 2001 año
73.0
-12.0
-14.12%
1 ene 2002 año
120.0
+47.0
64.38%
1 ene 2003 año
110.0
-10.0
-8.33%
1 ene 2004 año
110.0
0.0
0.0%
1 ene 2005 año
106.0
-4.0
-3.64%
1 ene 2006 año
98.0
-8.0
-7.55%
1 ene 2007 año
94.0
-4.0
-4.08%
1 ene 2008 año
90.0
-4.0
-4.26%
1 ene 2009 año
89.0
-1.0
-1.11%
1 ene 2010 año
87.0
-2.0
-2.25%
1 ene 2011 año
84.0
-3.0
-3.45%
1 ene 2012 año
79.0
-5.0
-5.95%
1 ene 2013 año
76.0
-3.0
-3.8%
1 ene 2014 año
72.0
-4.0
-5.26%
1 ene 2015 año
70.0
-2.0
-2.78%
1 ene 2016 año
69.0
-1.0
-1.43%

Ranking de los países por los datos estadísticos actuales