29
/es/
es
AIzaSyAYiBZKx7MnpbEhh9jyipgxe19OcubqV5w
April 1, 2024
278971
Uzbekistan
UZB
true
2
1
Manufacturing, value added (constant LCU)
2016,2015,2014,2013,2012,2011,2010,2009,2008,2007,2006,2005,2004,2003,2002,2001,2000,1999,1998,1997,1996
Download
Estadísticas Globales de la Biblioteca →Uzbekistan →

Manufacturing, value added (constant LCU)

Estas estadísticas en otros países:
AfghanistanAlbaniaAlgeriaAntigua and BarbudaArgentinaArmeniaAustraliaAustriaAzerbaijanBahamas, TheBahrainBangladeshBelarusBelgiumBelizeBeninBermudaBhutanBoliviaBosnia and HerzegovinaBotswanaBrazilBrunei DarussalamBurkina FasoBurundiCabo VerdeCambodiaCameroonCanadaCayman IslandsCentral African RepublicChadChileColombiaComorosCongo, Dem. Rep.Congo, Rep.Costa RicaCote d'IvoireCroatiaCubaCyprusCzech RepublicDenmarkDjiboutiDominicaDominican RepublicEcuadorEgypt, Arab Rep.El SalvadorEquatorial GuineaEritreaEstoniaEthiopiaFijiFinlandFranceGabonGambia, TheGeorgiaGermanyGhanaGreeceGrenadaGuatemalaGuineaGuyanaHaitiHondurasHong Kong SAR, ChinaHungaryIcelandIndiaIndonesiaIran, Islamic Rep.IraqIrelandItalyJamaicaJapanJordanKazakhstanKenyaKiribatiKorea, Rep.KosovoKuwaitKyrgyz RepublicLao PDRLatviaLebanonLesothoLiberiaLibyaLithuaniaLuxembourgMacedonia, FYRMadagascarMalawiMalaysiaMaldivesMarshall IslandsMauritaniaMauritiusMexicoMicronesia, Fed. Sts.MoldovaMongoliaMontenegroMoroccoMozambiqueMyanmarNamibiaNepalNetherlandsNew ZealandNicaraguaNigerNigeriaNorwayOmanPakistanPalauPanamaPapua New GuineaParaguayPeruPhilippinesPolandPortugalPuerto RicoQatarRomaniaRussian FederationRwandaSamoaSao Tome and PrincipeSaudi ArabiaSenegalSerbiaSeychellesSierra LeoneSingaporeSlovak RepublicSloveniaSolomon IslandsSomaliaSouth AfricaSpainSri LankaSt. Kitts and NevisSt. LuciaSt. Vincent and the GrenadinesSudanSurinameSwazilandSwedenSwitzerlandSyrian Arab RepublicTajikistanTanzaniaThailandTimor-LesteTogoTongaTrinidad and TobagoTunisiaTurkeyTuvaluUgandaUkraineUnited Arab EmiratesUnited KingdomUnited StatesUruguayUzbekistanVanuatuVenezuela, RBVietnamWest Bank and GazaZambiaZimbabwe
línea de tiempo (timeline):
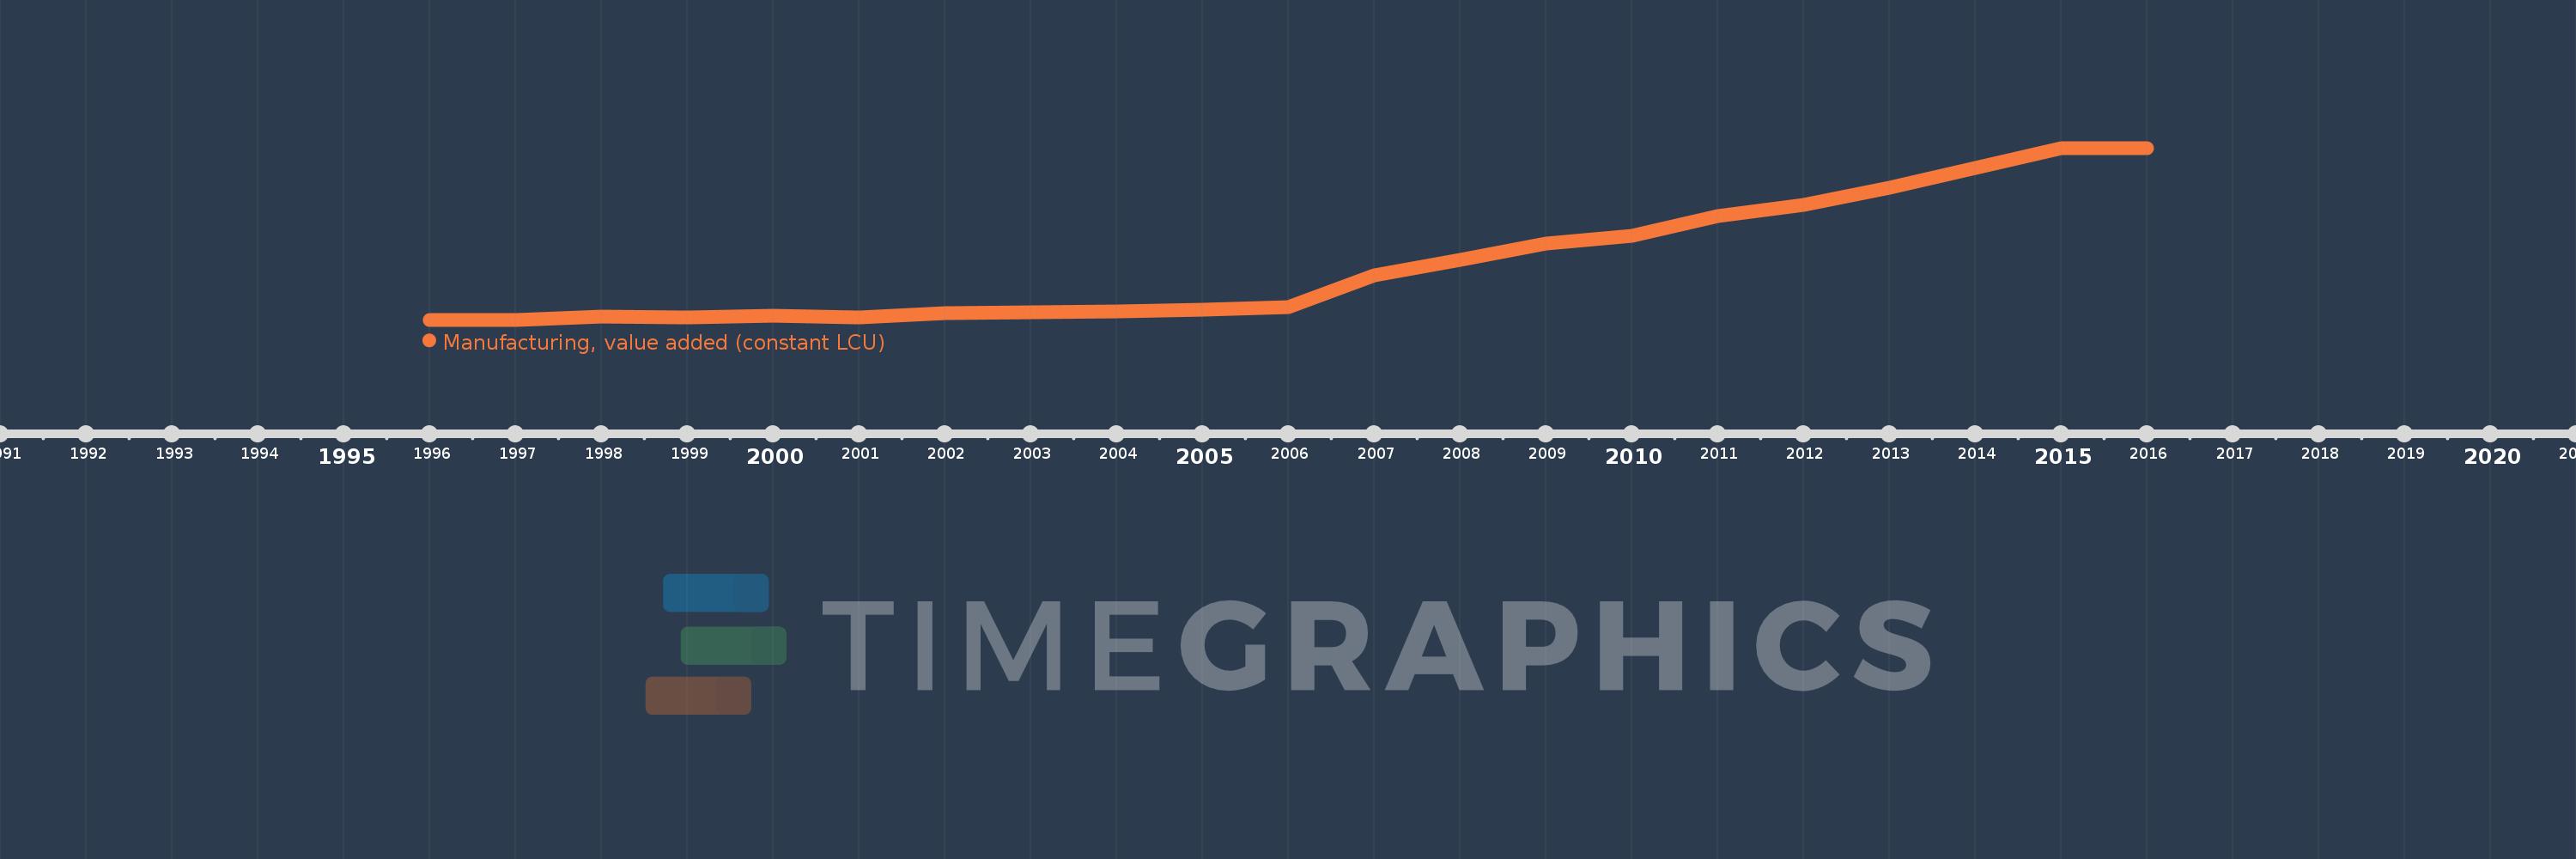
En esta escala de tiempo se presenta un gráfico de 1996 y 2016 de Uzbekistan. Los datos de 1995 están ausentes. El número de observaciones reales por fecha: 21.
Fuente (nombre):
Indicadores del desarrollo mundial
Fuente (organización):
World Bank national accounts data, and OECD National Accounts data files.
Categorías:
Economy & Growth
Se ha actualizado:
23 abr 2017 año
Los indicadores de los cambios de valor en los últimos años
En promedio:
164.766 bn
Mínimo:
100.26 bn
1 ene 1997 año
Máximo:
299.591 bn
1 ene 2015 año
A la fecha de observación
Valor
Cambio absoluto
El cambio con respecto al valor anterior
1 ene 1996 año
100.351 bn
+100.351 bn
0.0%
1 ene 1997 año
100.26 bn
-90.838 millones
-0.09%
1 ene 1998 año
103.668 bn
+3.408 bn
3.4%
1 ene 1999 año
102.509 bn
-1.159 bn
-1.12%
1 ene 2000 año
104.603 bn
+2.094 bn
2.04%
1 ene 2001 año
103.219 bn
-1.384 bn
-1.32%
1 ene 2002 año
108.359 bn
+5.14 bn
4.98%
1 ene 2003 año
108.904 bn
+544.632 millones
0.5%
1 ene 2004 año
110.031 bn
+1.127 bn
1.03%
1 ene 2005 año
112.232 bn
+2.201 bn
2.0%
1 ene 2006 año
114.476 bn
+2.245 bn
2.0%
1 ene 2007 año
151.767 bn
+37.291 bn
32.58%
1 ene 2008 año
170.161 bn
+18.394 bn
12.12%
1 ene 2009 año
188.811 bn
+18.65 bn
10.96%
1 ene 2010 año
197.383 bn
+8.572 bn
4.54%
1 ene 2011 año
220.477 bn
+23.094 bn
11.7%
1 ene 2012 año
233.22 bn
+12.744 bn
5.78%
1 ene 2013 año
253.744 bn
+20.523 bn
8.8%
1 ene 2014 año
276.733 bn
+22.989 bn
9.06%
1 ene 2015 año
299.591 bn
+22.858 bn
8.26%
1 ene 2016 año
299.591 bn
0.0
0.0%
Ranking de los países por los datos estadísticos actuales

Comentarios:

Enviar
PremiumAbout & FeedbackAcuerdoPrivacidad
logo
© 2022 Selected Technologies LLC – Morgan Hill, California