29
/es/
es
AIzaSyAYiBZKx7MnpbEhh9jyipgxe19OcubqV5w
April 1, 2024
159648
Ireland
IRL
true
2
1
Manufacturing, value added (constant LCU)
2016,2015,2014,2013,2012,2011,2010,2009,2008,2007,2006,2005,2004,2003,2002,2001,2000,1999,1998,1997,1996
Download
Estadísticas Globales de la Biblioteca →Ireland →

Manufacturing, value added (constant LCU)

Estas estadísticas en otros países:
AfghanistanAlbaniaAlgeriaAntigua and BarbudaArgentinaArmeniaAustraliaAustriaAzerbaijanBahamas, TheBahrainBangladeshBelarusBelgiumBelizeBeninBermudaBhutanBoliviaBosnia and HerzegovinaBotswanaBrazilBrunei DarussalamBurkina FasoBurundiCabo VerdeCambodiaCameroonCanadaCayman IslandsCentral African RepublicChadChileColombiaComorosCongo, Dem. Rep.Congo, Rep.Costa RicaCote d'IvoireCroatiaCubaCyprusCzech RepublicDenmarkDjiboutiDominicaDominican RepublicEcuadorEgypt, Arab Rep.El SalvadorEquatorial GuineaEritreaEstoniaEthiopiaFijiFinlandFranceGabonGambia, TheGeorgiaGermanyGhanaGreeceGrenadaGuatemalaGuineaGuyanaHaitiHondurasHong Kong SAR, ChinaHungaryIcelandIndiaIndonesiaIran, Islamic Rep.IraqIrelandItalyJamaicaJapanJordanKazakhstanKenyaKiribatiKorea, Rep.KosovoKuwaitKyrgyz RepublicLao PDRLatviaLebanonLesothoLiberiaLibyaLithuaniaLuxembourgMacedonia, FYRMadagascarMalawiMalaysiaMaldivesMarshall IslandsMauritaniaMauritiusMexicoMicronesia, Fed. Sts.MoldovaMongoliaMontenegroMoroccoMozambiqueMyanmarNamibiaNepalNetherlandsNew ZealandNicaraguaNigerNigeriaNorwayOmanPakistanPalauPanamaPapua New GuineaParaguayPeruPhilippinesPolandPortugalPuerto RicoQatarRomaniaRussian FederationRwandaSamoaSao Tome and PrincipeSaudi ArabiaSenegalSerbiaSeychellesSierra LeoneSingaporeSlovak RepublicSloveniaSolomon IslandsSomaliaSouth AfricaSpainSri LankaSt. Kitts and NevisSt. LuciaSt. Vincent and the GrenadinesSudanSurinameSwazilandSwedenSwitzerlandSyrian Arab RepublicTajikistanTanzaniaThailandTimor-LesteTogoTongaTrinidad and TobagoTunisiaTurkeyTuvaluUgandaUkraineUnited Arab EmiratesUnited KingdomUnited StatesUruguayUzbekistanVanuatuVenezuela, RBVietnamWest Bank and GazaZambiaZimbabwe
línea de tiempo (timeline):
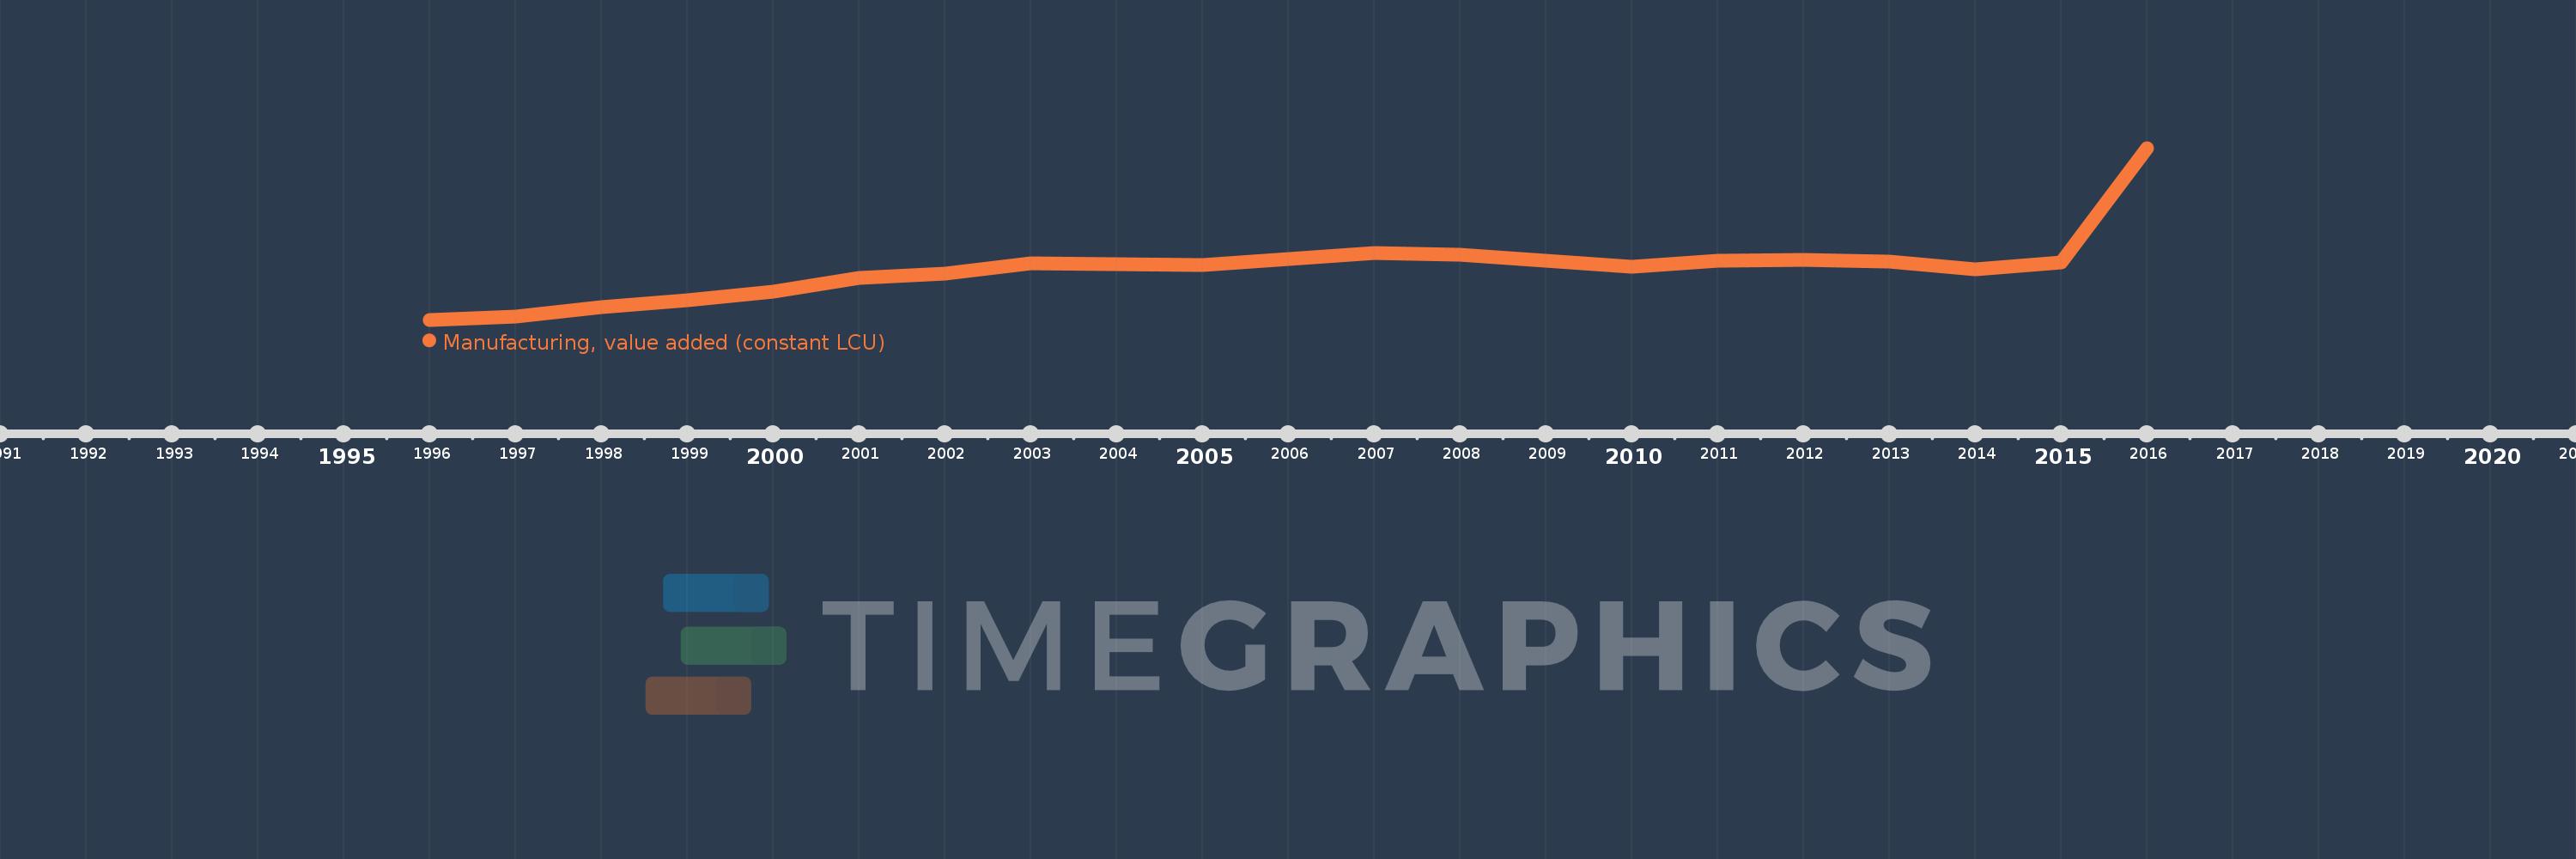
En esta escala de tiempo se presenta un gráfico de 1996 y 2016 de Ireland. Los datos de 1995 están ausentes. El número de observaciones reales por fecha: 21.
Fuente (nombre):
Indicadores del desarrollo mundial
Fuente (organización):
World Bank national accounts data, and OECD National Accounts data files.
Categorías:
Economy & Growth
Se ha actualizado:
23 abr 2017 año
Los indicadores de los cambios de valor en los últimos años
En promedio:
30.366 bn
Mínimo:
14.723 bn
1 ene 1996 año
Máximo:
67.036 bn
1 ene 2016 año
A la fecha de observación
Valor
Cambio absoluto
El cambio con respecto al valor anterior
1 ene 1996 año
14.723 bn
+14.723 bn
0.0%
1 ene 1997 año
15.712 bn
+988.918 millones
6.72%
1 ene 1998 año
18.547 bn
+2.835 bn
18.04%
1 ene 1999 año
20.662 bn
+2.115 bn
11.4%
1 ene 2000 año
23.395 bn
+2.733 bn
13.23%
1 ene 2001 año
27.342 bn
+3.947 bn
16.87%
1 ene 2002 año
28.81 bn
+1.468 bn
5.37%
1 ene 2003 año
31.823 bn
+3.014 bn
10.46%
1 ene 2004 año
31.593 bn
-229.921 millones
-0.72%
1 ene 2005 año
31.469 bn
-123.907 millones
-0.39%
1 ene 2006 año
33.327 bn
+1.858 bn
5.9%
1 ene 2007 año
35.055 bn
+1.728 bn
5.18%
1 ene 2008 año
34.501 bn
-554.033 millones
-1.58%
1 ene 2009 año
32.68 bn
-1.82 bn
-5.28%
1 ene 2010 año
30.788 bn
-1.892 bn
-5.79%
1 ene 2011 año
32.758 bn
+1.969 bn
6.4%
1 ene 2012 año
32.923 bn
+164.697 millones
0.5%
1 ene 2013 año
32.354 bn
-568.391 millones
-1.73%
1 ene 2014 año
30.122 bn
-2.232 bn
-6.9%
1 ene 2015 año
32.062 bn
+1.941 bn
6.44%
1 ene 2016 año
67.036 bn
+34.973 bn
109.08%
Ranking de los países por los datos estadísticos actuales

Comentarios:

Enviar
PremiumAbout & FeedbackAcuerdoPrivacidad
logo
© 2022 Selected Technologies LLC – Morgan Hill, California