29
/es/
es
AIzaSyAYiBZKx7MnpbEhh9jyipgxe19OcubqV5w
April 1, 2024
247791
Spain
ESP
true
2
1
Manufacturing, value added (constant LCU)
2016,2015,2014,2013,2012,2011,2010,2009,2008,2007,2006,2005,2004,2003,2002,2001,2000,1999,1998,1997,1996
Download
Estadísticas Globales de la Biblioteca →Spain →

Manufacturing, value added (constant LCU)

Estas estadísticas en otros países:
AfghanistanAlbaniaAlgeriaAntigua and BarbudaArgentinaArmeniaAustraliaAustriaAzerbaijanBahamas, TheBahrainBangladeshBelarusBelgiumBelizeBeninBermudaBhutanBoliviaBosnia and HerzegovinaBotswanaBrazilBrunei DarussalamBurkina FasoBurundiCabo VerdeCambodiaCameroonCanadaCayman IslandsCentral African RepublicChadChileColombiaComorosCongo, Dem. Rep.Congo, Rep.Costa RicaCote d'IvoireCroatiaCubaCyprusCzech RepublicDenmarkDjiboutiDominicaDominican RepublicEcuadorEgypt, Arab Rep.El SalvadorEquatorial GuineaEritreaEstoniaEthiopiaFijiFinlandFranceGabonGambia, TheGeorgiaGermanyGhanaGreeceGrenadaGuatemalaGuineaGuyanaHaitiHondurasHong Kong SAR, ChinaHungaryIcelandIndiaIndonesiaIran, Islamic Rep.IraqIrelandItalyJamaicaJapanJordanKazakhstanKenyaKiribatiKorea, Rep.KosovoKuwaitKyrgyz RepublicLao PDRLatviaLebanonLesothoLiberiaLibyaLithuaniaLuxembourgMacedonia, FYRMadagascarMalawiMalaysiaMaldivesMarshall IslandsMauritaniaMauritiusMexicoMicronesia, Fed. Sts.MoldovaMongoliaMontenegroMoroccoMozambiqueMyanmarNamibiaNepalNetherlandsNew ZealandNicaraguaNigerNigeriaNorwayOmanPakistanPalauPanamaPapua New GuineaParaguayPeruPhilippinesPolandPortugalPuerto RicoQatarRomaniaRussian FederationRwandaSamoaSao Tome and PrincipeSaudi ArabiaSenegalSerbiaSeychellesSierra LeoneSingaporeSlovak RepublicSloveniaSolomon IslandsSomaliaSouth AfricaSpainSri LankaSt. Kitts and NevisSt. LuciaSt. Vincent and the GrenadinesSudanSurinameSwazilandSwedenSwitzerlandSyrian Arab RepublicTajikistanTanzaniaThailandTimor-LesteTogoTongaTrinidad and TobagoTunisiaTurkeyTuvaluUgandaUkraineUnited Arab EmiratesUnited KingdomUnited StatesUruguayUzbekistanVanuatuVenezuela, RBVietnamWest Bank and GazaZambiaZimbabwe
línea de tiempo (timeline):
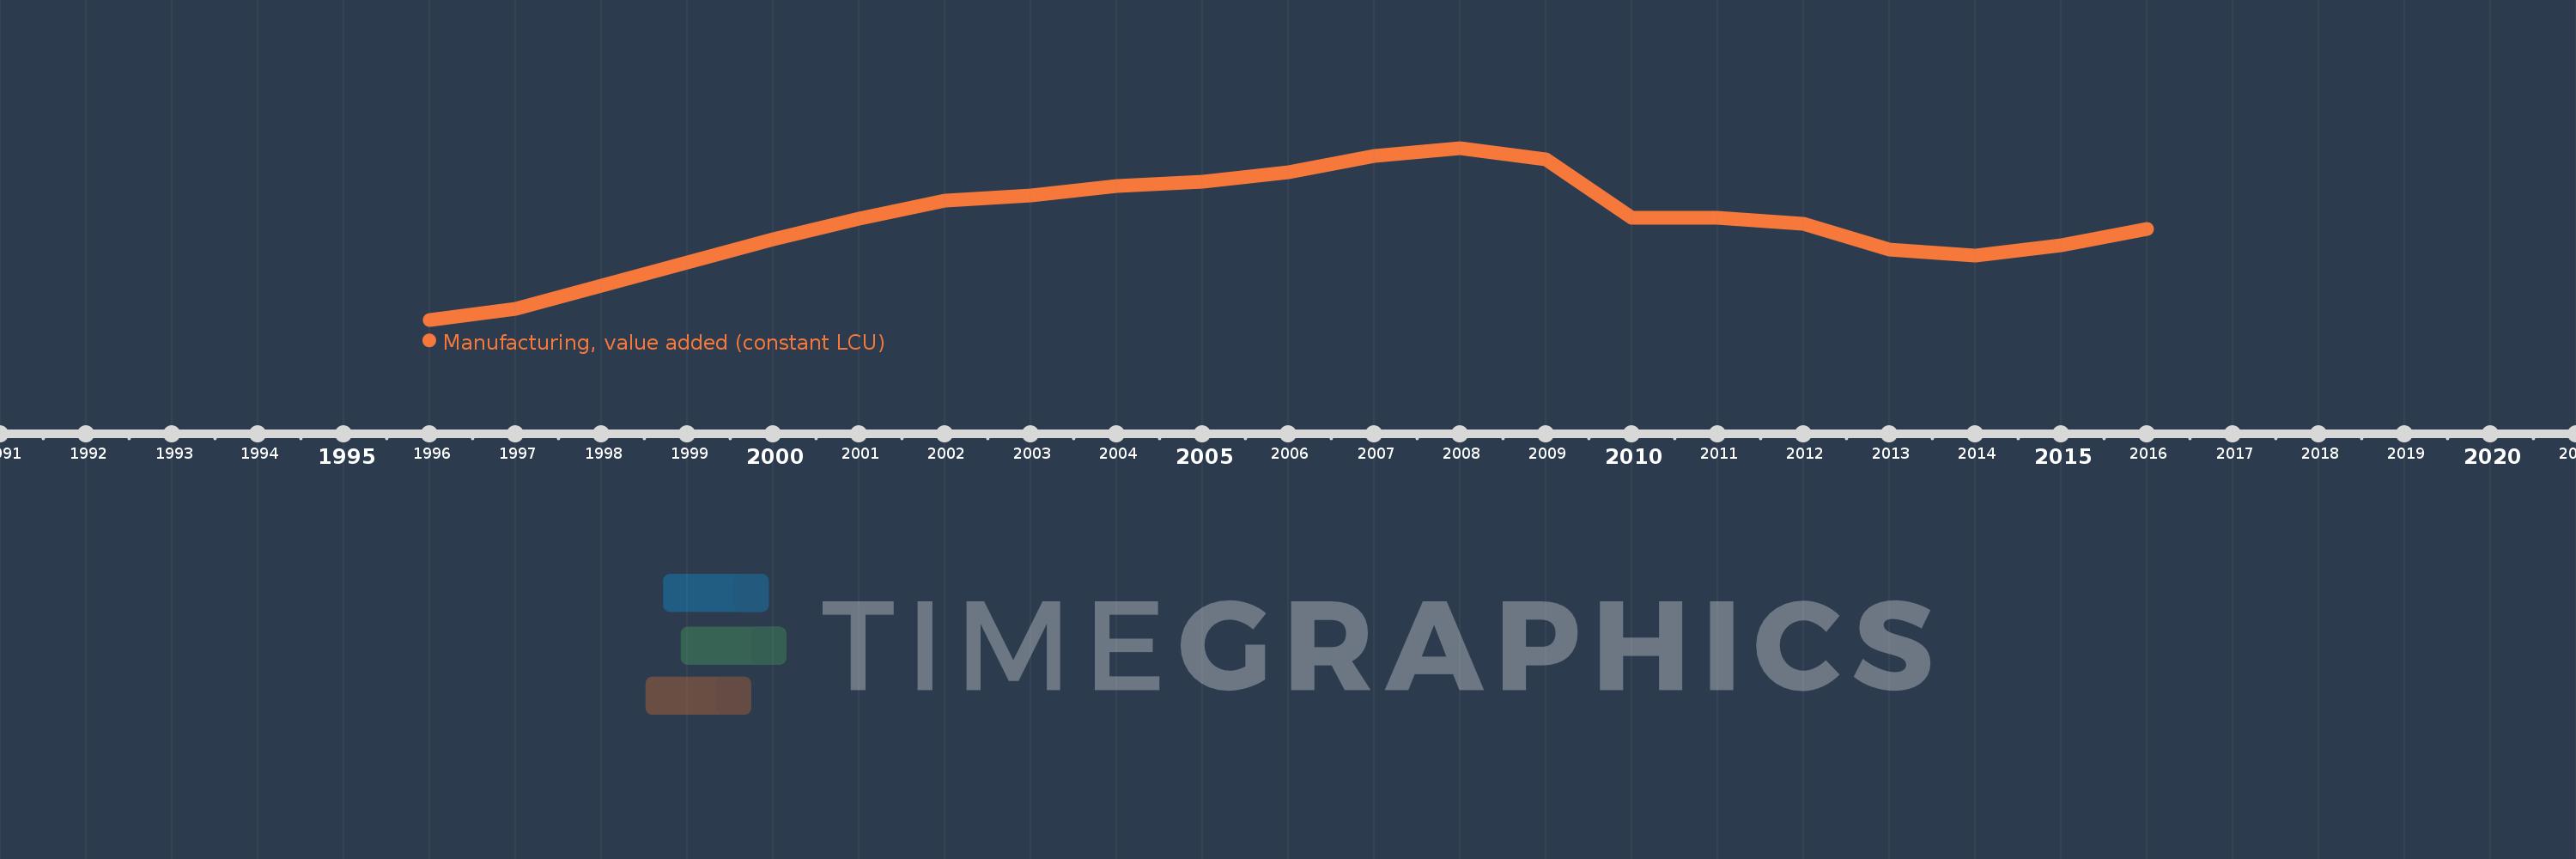
En esta escala de tiempo se presenta un gráfico de 1996 y 2016 de Spain. Los datos de 1995 están ausentes. El número de observaciones reales por fecha: 21.
Fuente (nombre):
Indicadores del desarrollo mundial
Fuente (organización):
World Bank national accounts data, and OECD National Accounts data files.
Categorías:
Economy & Growth
Se ha actualizado:
23 abr 2017 año
Los indicadores de los cambios de valor en los últimos años
En promedio:
130.184 bn
Mínimo:
103.442 bn
1 ene 1996 año
Máximo:
150.688 bn
1 ene 2008 año
A la fecha de observación
Valor
Cambio absoluto
El cambio con respecto al valor anterior
1 ene 1996 año
103.442 bn
+103.442 bn
0.0%
1 ene 1997 año
106.368 bn
+2.926 bn
2.83%
1 ene 1998 año
112.871 bn
+6.503 bn
6.11%
1 ene 1999 año
119.292 bn
+6.421 bn
5.69%
1 ene 2000 año
125.46 bn
+6.168 bn
5.17%
1 ene 2001 año
131.288 bn
+5.828 bn
4.65%
1 ene 2002 año
136.254 bn
+4.966 bn
3.78%
1 ene 2003 año
137.617 bn
+1.363 bn
1.0%
1 ene 2004 año
140.25 bn
+2.633 bn
1.91%
1 ene 2005 año
141.412 bn
+1.162 bn
0.83%
1 ene 2006 año
144.011 bn
+2.599 bn
1.84%
1 ene 2007 año
148.571 bn
+4.56 bn
3.17%
1 ene 2008 año
150.688 bn
+2.117 bn
1.42%
1 ene 2009 año
147.531 bn
-3.157 bn
-2.1%
1 ene 2010 año
131.433 bn
-16.098 bn
-10.91%
1 ene 2011 año
131.436 bn
+3.0 millones
0.0%
1 ene 2012 año
129.72 bn
-1.716 bn
-1.31%
1 ene 2013 año
122.801 bn
-6.919 bn
-5.33%
1 ene 2014 año
121.144 bn
-1.657 bn
-1.35%
1 ene 2015 año
123.822 bn
+2.678 bn
2.21%
1 ene 2016 año
128.443 bn
+4.621 bn
3.73%
Ranking de los países por los datos estadísticos actuales

Comentarios:

Enviar
PremiumAbout & FeedbackAcuerdoPrivacidad
logo
© 2022 Selected Technologies LLC – Morgan Hill, California