29
/es/
es
AIzaSyAYiBZKx7MnpbEhh9jyipgxe19OcubqV5w
April 1, 2024
139505
Germany
DEU
true
2
1
Manufacturing, value added (constant LCU)
2016,2015,2014,2013,2012,2011,2010,2009,2008,2007,2006,2005,2004,2003,2002,2001,2000,1999,1998,1997,1996,1995,1994,1993,1992
Download
Estadísticas Globales de la Biblioteca →Germany →

Manufacturing, value added (constant LCU)

Estas estadísticas en otros países:
AfghanistanAlbaniaAlgeriaAntigua and BarbudaArgentinaArmeniaAustraliaAustriaAzerbaijanBahamas, TheBahrainBangladeshBelarusBelgiumBelizeBeninBermudaBhutanBoliviaBosnia and HerzegovinaBotswanaBrazilBrunei DarussalamBurkina FasoBurundiCabo VerdeCambodiaCameroonCanadaCayman IslandsCentral African RepublicChadChileColombiaComorosCongo, Dem. Rep.Congo, Rep.Costa RicaCote d'IvoireCroatiaCubaCyprusCzech RepublicDenmarkDjiboutiDominicaDominican RepublicEcuadorEgypt, Arab Rep.El SalvadorEquatorial GuineaEritreaEstoniaEthiopiaFijiFinlandFranceGabonGambia, TheGeorgiaGermanyGhanaGreeceGrenadaGuatemalaGuineaGuyanaHaitiHondurasHong Kong SAR, ChinaHungaryIcelandIndiaIndonesiaIran, Islamic Rep.IraqIrelandItalyJamaicaJapanJordanKazakhstanKenyaKiribatiKorea, Rep.KosovoKuwaitKyrgyz RepublicLao PDRLatviaLebanonLesothoLiberiaLibyaLithuaniaLuxembourgMacedonia, FYRMadagascarMalawiMalaysiaMaldivesMarshall IslandsMauritaniaMauritiusMexicoMicronesia, Fed. Sts.MoldovaMongoliaMontenegroMoroccoMozambiqueMyanmarNamibiaNepalNetherlandsNew ZealandNicaraguaNigerNigeriaNorwayOmanPakistanPalauPanamaPapua New GuineaParaguayPeruPhilippinesPolandPortugalPuerto RicoQatarRomaniaRussian FederationRwandaSamoaSao Tome and PrincipeSaudi ArabiaSenegalSerbiaSeychellesSierra LeoneSingaporeSlovak RepublicSloveniaSolomon IslandsSomaliaSouth AfricaSpainSri LankaSt. Kitts and NevisSt. LuciaSt. Vincent and the GrenadinesSudanSurinameSwazilandSwedenSwitzerlandSyrian Arab RepublicTajikistanTanzaniaThailandTimor-LesteTogoTongaTrinidad and TobagoTunisiaTurkeyTuvaluUgandaUkraineUnited Arab EmiratesUnited KingdomUnited StatesUruguayUzbekistanVanuatuVenezuela, RBVietnamWest Bank and GazaZambiaZimbabwe
línea de tiempo (timeline):
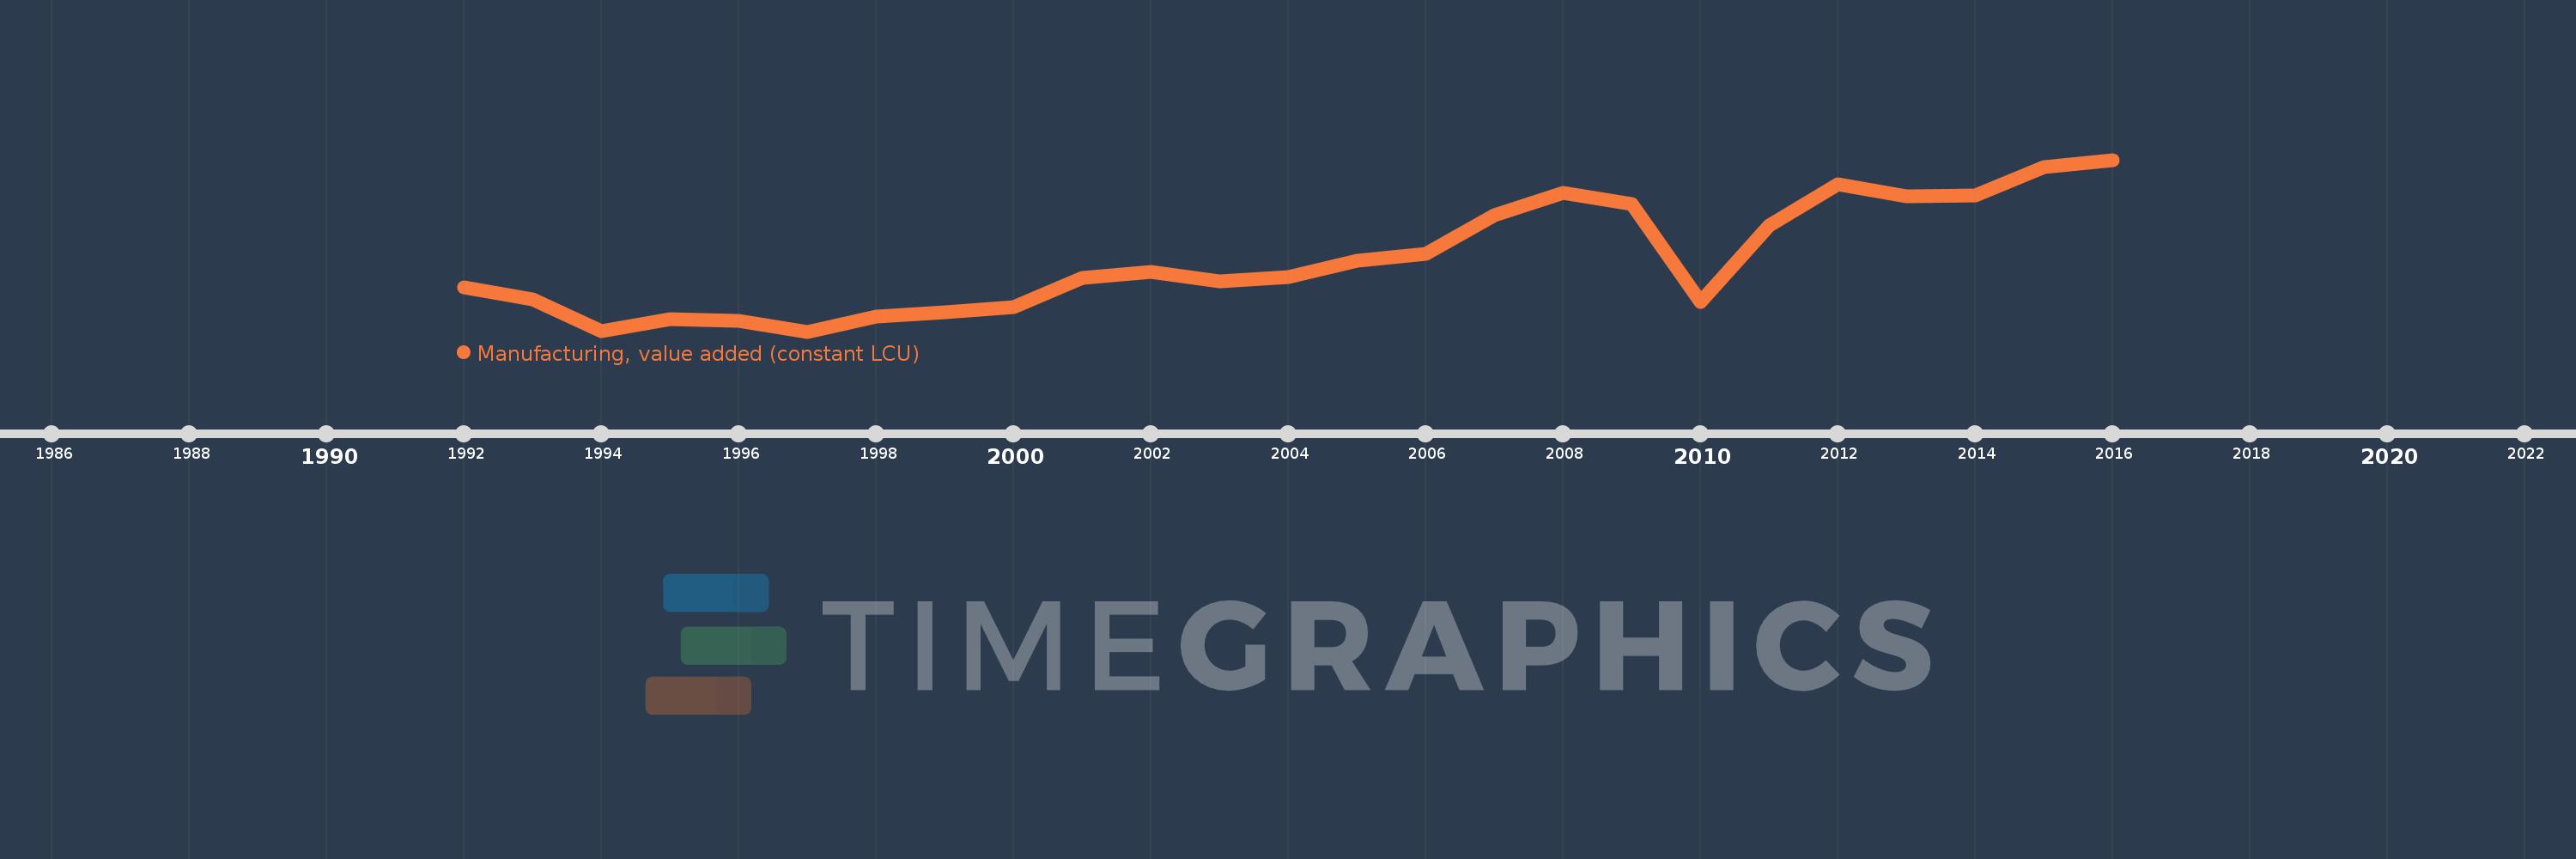
En esta escala de tiempo se presenta un gráfico de 1992 y 2016 de Germany. Los datos de 1991 están ausentes. El número de observaciones reales por fecha: 25.
Fuente (nombre):
Indicadores del desarrollo mundial
Fuente (organización):
World Bank national accounts data, and OECD National Accounts data files.
Categorías:
Economy & Growth
Se ha actualizado:
23 abr 2017 año
Los indicadores de los cambios de valor en los últimos años
En promedio:
479.498 bn
Mínimo:
403.485 bn
1 ene 1997 año
Máximo:
585.084 bn
1 ene 2016 año
A la fecha de observación
Valor
Cambio absoluto
El cambio con respecto al valor anterior
1 ene 1992 año
449.851 bn
+449.851 bn
0.0%
1 ene 1993 año
437.332 bn
-12.519 bn
-2.78%
1 ene 1994 año
403.794 bn
-33.538 bn
-7.67%
1 ene 1995 año
416.261 bn
+12.467 bn
3.09%
1 ene 1996 año
414.87 bn
-1.391 bn
-0.33%
1 ene 1997 año
403.485 bn
-11.385 bn
-2.74%
1 ene 1998 año
419.713 bn
+16.228 bn
4.02%
1 ene 1999 año
424.247 bn
+4.534 bn
1.08%
1 ene 2000 año
428.935 bn
+4.688 bn
1.11%
1 ene 2001 año
460.103 bn
+31.168 bn
7.27%
1 ene 2002 año
466.336 bn
+6.234 bn
1.35%
1 ene 2003 año
456.651 bn
-9.685 bn
-2.08%
1 ene 2004 año
460.979 bn
+4.327 bn
0.95%
1 ene 2005 año
478.185 bn
+17.207 bn
3.73%
1 ene 2006 año
485.862 bn
+7.676 bn
1.61%
1 ene 2007 año
526.715 bn
+40.853 bn
8.41%
1 ene 2008 año
549.743 bn
+23.028 bn
4.37%
1 ene 2009 año
538.512 bn
-11.231 bn
-2.04%
1 ene 2010 año
435.065 bn
-103.447 bn
-19.21%
1 ene 2011 año
515.175 bn
+80.11 bn
18.41%
1 ene 2012 año
559.068 bn
+43.893 bn
8.52%
1 ene 2013 año
546.601 bn
-12.467 bn
-2.23%
1 ene 2014 año
547.322 bn
+721.24 millones
0.13%
1 ene 2015 año
577.563 bn
+30.241 bn
5.53%
1 ene 2016 año
585.084 bn
+7.522 bn
1.3%
Ranking de los países por los datos estadísticos actuales

Comentarios:

Enviar
PremiumAbout & FeedbackAcuerdoPrivacidad
logo
© 2022 Selected Technologies LLC – Morgan Hill, California