29
/es/
es
AIzaSyAYiBZKx7MnpbEhh9jyipgxe19OcubqV5w
April 1, 2024
118138
Czech Republic
CZE
true
2
1
Manufacturing, value added (constant LCU)
2016,2015,2014,2013,2012,2011,2010,2009,2008,2007,2006,2005,2004,2003,2002,2001,2000,1999,1998,1997,1996,1995,1994
Download
Estadísticas Globales de la Biblioteca →Czech Republic →

Manufacturing, value added (constant LCU)

Estas estadísticas en otros países:
AfghanistanAlbaniaAlgeriaAntigua and BarbudaArgentinaArmeniaAustraliaAustriaAzerbaijanBahamas, TheBahrainBangladeshBelarusBelgiumBelizeBeninBermudaBhutanBoliviaBosnia and HerzegovinaBotswanaBrazilBrunei DarussalamBurkina FasoBurundiCabo VerdeCambodiaCameroonCanadaCayman IslandsCentral African RepublicChadChileColombiaComorosCongo, Dem. Rep.Congo, Rep.Costa RicaCote d'IvoireCroatiaCubaCyprusCzech RepublicDenmarkDjiboutiDominicaDominican RepublicEcuadorEgypt, Arab Rep.El SalvadorEquatorial GuineaEritreaEstoniaEthiopiaFijiFinlandFranceGabonGambia, TheGeorgiaGermanyGhanaGreeceGrenadaGuatemalaGuineaGuyanaHaitiHondurasHong Kong SAR, ChinaHungaryIcelandIndiaIndonesiaIran, Islamic Rep.IraqIrelandItalyJamaicaJapanJordanKazakhstanKenyaKiribatiKorea, Rep.KosovoKuwaitKyrgyz RepublicLao PDRLatviaLebanonLesothoLiberiaLibyaLithuaniaLuxembourgMacedonia, FYRMadagascarMalawiMalaysiaMaldivesMarshall IslandsMauritaniaMauritiusMexicoMicronesia, Fed. Sts.MoldovaMongoliaMontenegroMoroccoMozambiqueMyanmarNamibiaNepalNetherlandsNew ZealandNicaraguaNigerNigeriaNorwayOmanPakistanPalauPanamaPapua New GuineaParaguayPeruPhilippinesPolandPortugalPuerto RicoQatarRomaniaRussian FederationRwandaSamoaSao Tome and PrincipeSaudi ArabiaSenegalSerbiaSeychellesSierra LeoneSingaporeSlovak RepublicSloveniaSolomon IslandsSomaliaSouth AfricaSpainSri LankaSt. Kitts and NevisSt. LuciaSt. Vincent and the GrenadinesSudanSurinameSwazilandSwedenSwitzerlandSyrian Arab RepublicTajikistanTanzaniaThailandTimor-LesteTogoTongaTrinidad and TobagoTunisiaTurkeyTuvaluUgandaUkraineUnited Arab EmiratesUnited KingdomUnited StatesUruguayUzbekistanVanuatuVenezuela, RBVietnamWest Bank and GazaZambiaZimbabwe
línea de tiempo (timeline):
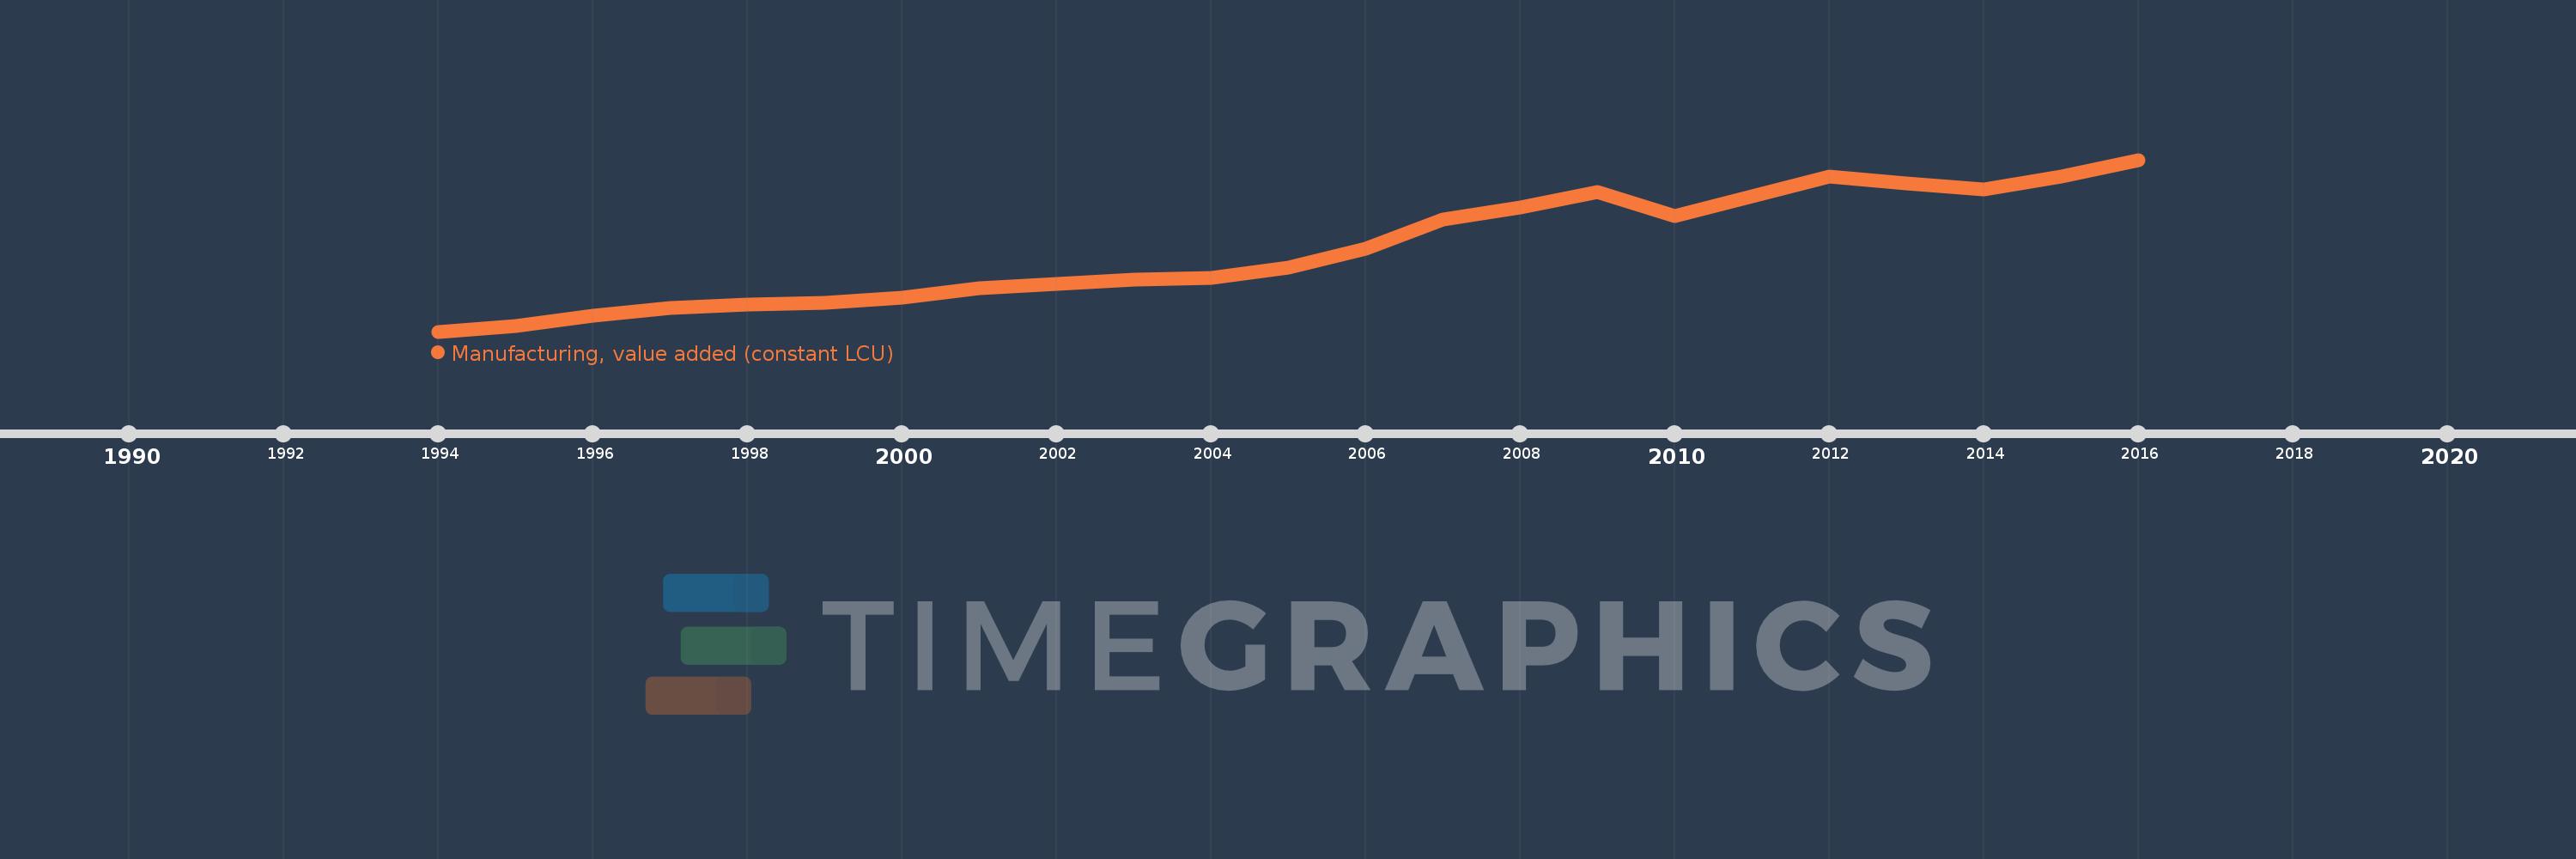
En esta escala de tiempo se presenta un gráfico de 1994 y 2016 de Czech Republic. Los datos de 1993 están ausentes. El número de observaciones reales por fecha: 23.
Fuente (nombre):
Indicadores del desarrollo mundial
Fuente (organización):
World Bank national accounts data, and OECD National Accounts data files.
Categorías:
Economy & Growth
Se ha actualizado:
23 abr 2017 año
Los indicadores de los cambios de valor en los últimos años
En promedio:
610.123 bn
Mínimo:
259.392 bn
1 ene 1994 año
Máximo:
998.236 bn
1 ene 2016 año
A la fecha de observación
Valor
Cambio absoluto
El cambio con respecto al valor anterior
1 ene 1994 año
259.392 bn
+259.392 bn
0.0%
1 ene 1995 año
284.582 bn
+25.19 bn
9.71%
1 ene 1996 año
326.056 bn
+41.474 bn
14.57%
1 ene 1997 año
360.851 bn
+34.795 bn
10.67%
1 ene 1998 año
376.101 bn
+15.25 bn
4.23%
1 ene 1999 año
382.416 bn
+6.315 bn
1.68%
1 ene 2000 año
406.36 bn
+23.944 bn
6.26%
1 ene 2001 año
446.67 bn
+40.31 bn
9.92%
1 ene 2002 año
463.744 bn
+17.074 bn
3.82%
1 ene 2003 año
482.414 bn
+18.67 bn
4.03%
1 ene 2004 año
490.37 bn
+7.956 bn
1.65%
1 ene 2005 año
533.348 bn
+42.978 bn
8.76%
1 ene 2006 año
616.179 bn
+82.831 bn
15.53%
1 ene 2007 año
742.48 bn
+126.301 bn
20.5%
1 ene 2008 año
792.864 bn
+50.384 bn
6.79%
1 ene 2009 año
859.425 bn
+66.561 bn
8.4%
1 ene 2010 año
755.781 bn
-103.644 bn
-12.06%
1 ene 2011 año
840.146 bn
+84.365 bn
11.16%
1 ene 2012 año
924.958 bn
+84.812 bn
10.09%
1 ene 2013 año
895.2 bn
-29.758 bn
-3.22%
1 ene 2014 año
870.703 bn
-24.497 bn
-2.74%
1 ene 2015 año
924.555 bn
+53.852 bn
6.18%
1 ene 2016 año
998.236 bn
+73.681 bn
7.97%
Ranking de los países por los datos estadísticos actuales

Comentarios:

Enviar
PremiumAbout & FeedbackAcuerdoPrivacidad
logo
© 2022 Selected Technologies LLC – Morgan Hill, California