29
/es/
es
AIzaSyAYiBZKx7MnpbEhh9jyipgxe19OcubqV5w
April 1, 2024
225096
Poland
POL
true
2
1
Manufacturing, value added (constant LCU)
2016,2015,2014,2013,2012,2011,2010,2009,2008,2007,2006,2005,2004,2003,2002,2001,2000,1999,1998,1997
Download
Estadísticas Globales de la Biblioteca →Poland →

Manufacturing, value added (constant LCU)

Estas estadísticas en otros países:
AfghanistanAlbaniaAlgeriaAntigua and BarbudaArgentinaArmeniaAustraliaAustriaAzerbaijanBahamas, TheBahrainBangladeshBelarusBelgiumBelizeBeninBermudaBhutanBoliviaBosnia and HerzegovinaBotswanaBrazilBrunei DarussalamBurkina FasoBurundiCabo VerdeCambodiaCameroonCanadaCayman IslandsCentral African RepublicChadChileColombiaComorosCongo, Dem. Rep.Congo, Rep.Costa RicaCote d'IvoireCroatiaCubaCyprusCzech RepublicDenmarkDjiboutiDominicaDominican RepublicEcuadorEgypt, Arab Rep.El SalvadorEquatorial GuineaEritreaEstoniaEthiopiaFijiFinlandFranceGabonGambia, TheGeorgiaGermanyGhanaGreeceGrenadaGuatemalaGuineaGuyanaHaitiHondurasHong Kong SAR, ChinaHungaryIcelandIndiaIndonesiaIran, Islamic Rep.IraqIrelandItalyJamaicaJapanJordanKazakhstanKenyaKiribatiKorea, Rep.KosovoKuwaitKyrgyz RepublicLao PDRLatviaLebanonLesothoLiberiaLibyaLithuaniaLuxembourgMacedonia, FYRMadagascarMalawiMalaysiaMaldivesMarshall IslandsMauritaniaMauritiusMexicoMicronesia, Fed. Sts.MoldovaMongoliaMontenegroMoroccoMozambiqueMyanmarNamibiaNepalNetherlandsNew ZealandNicaraguaNigerNigeriaNorwayOmanPakistanPalauPanamaPapua New GuineaParaguayPeruPhilippinesPolandPortugalPuerto RicoQatarRomaniaRussian FederationRwandaSamoaSao Tome and PrincipeSaudi ArabiaSenegalSerbiaSeychellesSierra LeoneSingaporeSlovak RepublicSloveniaSolomon IslandsSomaliaSouth AfricaSpainSri LankaSt. Kitts and NevisSt. LuciaSt. Vincent and the GrenadinesSudanSurinameSwazilandSwedenSwitzerlandSyrian Arab RepublicTajikistanTanzaniaThailandTimor-LesteTogoTongaTrinidad and TobagoTunisiaTurkeyTuvaluUgandaUkraineUnited Arab EmiratesUnited KingdomUnited StatesUruguayUzbekistanVanuatuVenezuela, RBVietnamWest Bank and GazaZambiaZimbabwe
línea de tiempo (timeline):
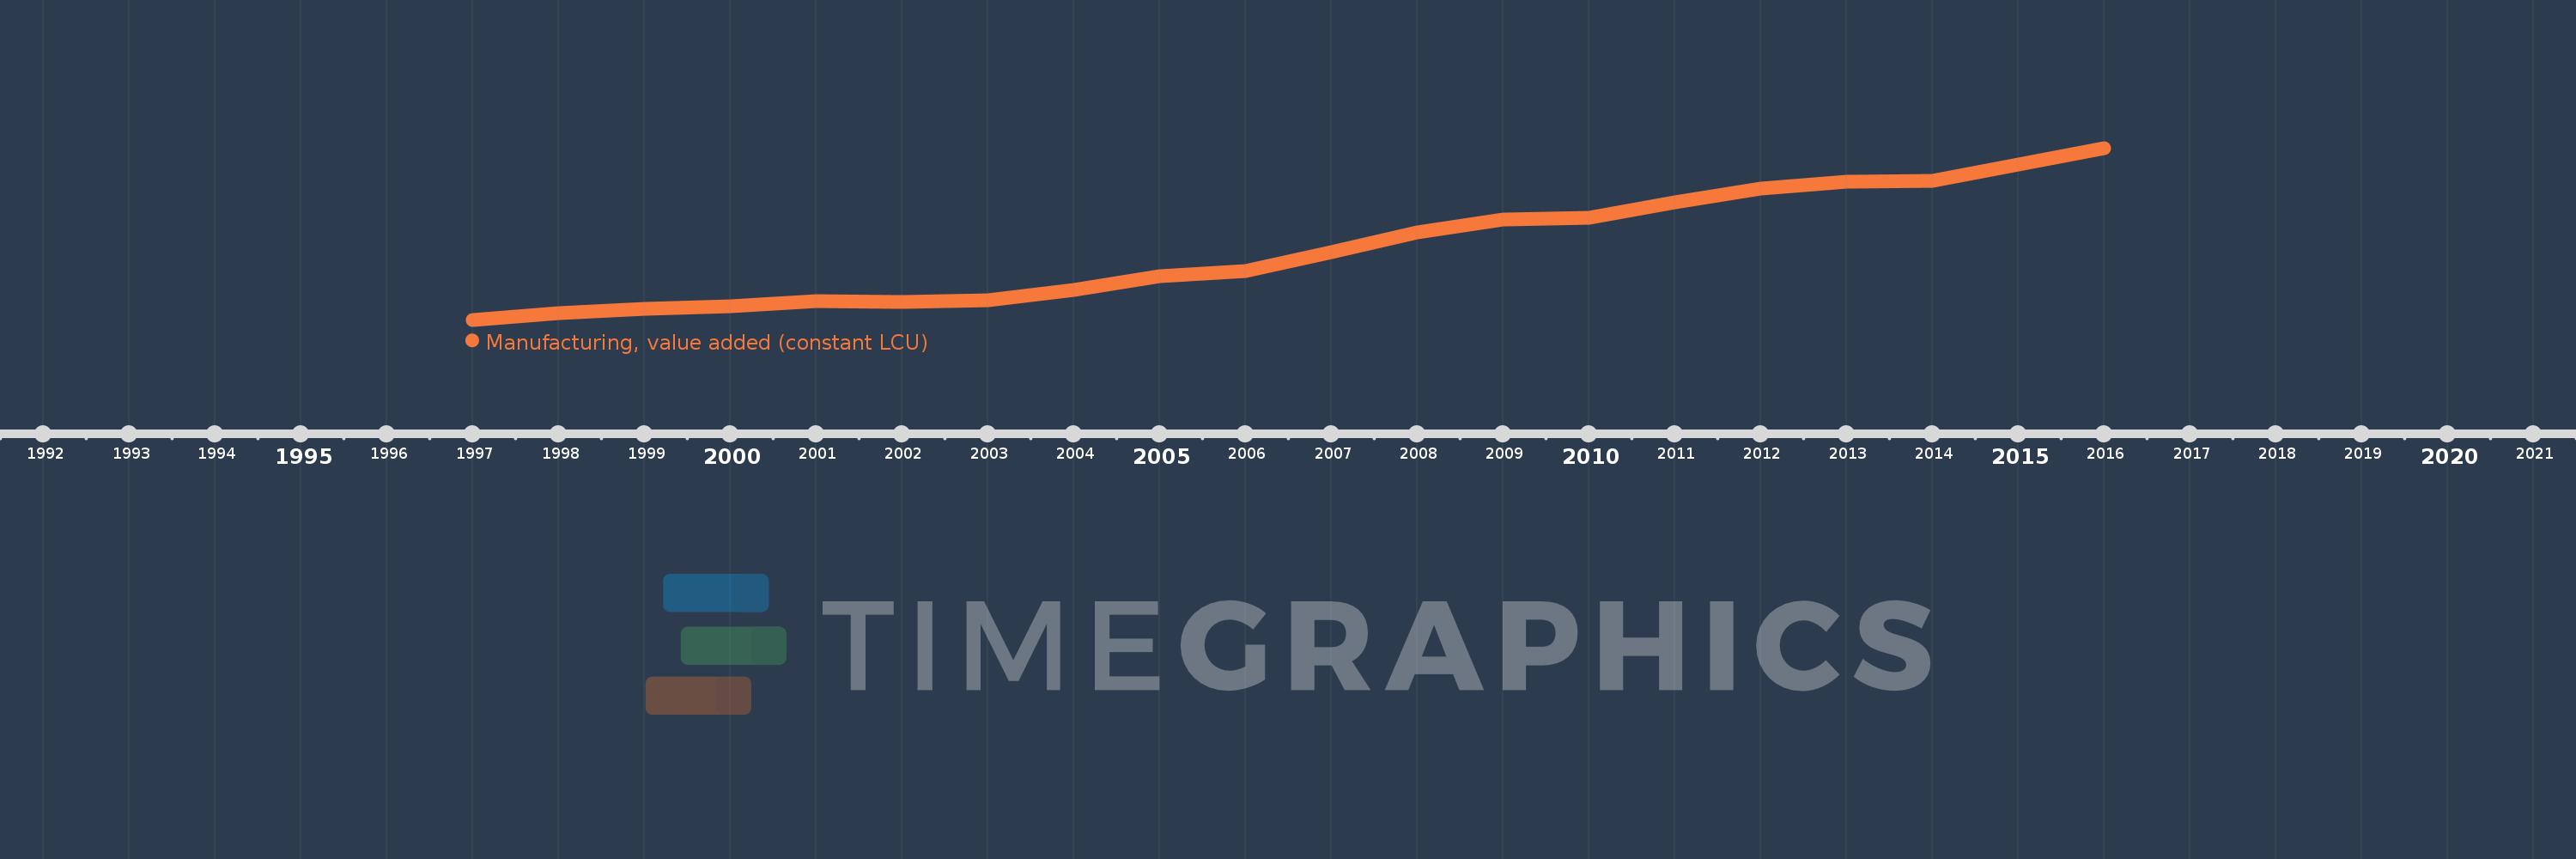
En esta escala de tiempo se presenta un gráfico de 1997 y 2016 de Poland. Los datos de 1996 están ausentes. El número de observaciones reales por fecha: 20.
Fuente (nombre):
Indicadores del desarrollo mundial
Fuente (organización):
World Bank national accounts data, and OECD National Accounts data files.
Categorías:
Economy & Growth
Se ha actualizado:
23 abr 2017 año
Los indicadores de los cambios de valor en los últimos años
En promedio:
168.542 bn
Mínimo:
81.853 bn
1 ene 1997 año
Máximo:
291.748 bn
1 ene 2016 año
A la fecha de observación
Valor
Cambio absoluto
El cambio con respecto al valor anterior
1 ene 1997 año
81.853 bn
+81.853 bn
0.0%
1 ene 1998 año
90.071 bn
+8.217 bn
10.04%
1 ene 1999 año
95.444 bn
+5.374 bn
5.97%
1 ene 2000 año
98.252 bn
+2.808 bn
2.94%
1 ene 2001 año
104.764 bn
+6.512 bn
6.63%
1 ene 2002 año
103.505 bn
-1.259 bn
-1.2%
1 ene 2003 año
106.049 bn
+2.544 bn
2.46%
1 ene 2004 año
118.741 bn
+12.692 bn
11.97%
1 ene 2005 año
134.845 bn
+16.104 bn
13.56%
1 ene 2006 año
141.195 bn
+6.351 bn
4.71%
1 ene 2007 año
164.79 bn
+23.594 bn
16.71%
1 ene 2008 año
188.179 bn
+23.389 bn
14.19%
1 ene 2009 año
203.998 bn
+15.819 bn
8.41%
1 ene 2010 año
206.685 bn
+2.687 bn
1.32%
1 ene 2011 año
224.845 bn
+18.16 bn
8.79%
1 ene 2012 año
242.562 bn
+17.717 bn
7.88%
1 ene 2013 año
250.424 bn
+7.862 bn
3.24%
1 ene 2014 año
251.461 bn
+1.037 bn
0.41%
1 ene 2015 año
271.433 bn
+19.972 bn
7.94%
1 ene 2016 año
291.748 bn
+20.315 bn
7.48%
Ranking de los países por los datos estadísticos actuales

Comentarios:

Enviar
PremiumAbout & FeedbackAcuerdoPrivacidad
logo
© 2022 Selected Technologies LLC – Morgan Hill, California