30
/de/
AIzaSyAYiBZKx7MnpbEhh9jyipgxe19OcubqV5w
April 1, 2024
90178
Botswana
BWA
true
2
1
Net official flows from UN agencies, IFAD (current US$)
2015,2013,2003,2001,2000,1999,1998,1997,1996,1995,1994,1993,1992,1989,1988,1987,1986,1985,1984
Download
Bibliothek der Globalstatistik →Botswana →

Net official flows from UN agencies, IFAD (current US$)

Diese Statistik in anderen Ländern:

AfghanistanAlbaniaAlgeriaAngolaArab WorldArgentinaArmeniaAzerbaijanBangladeshBelizeBeninBhutanBoliviaBosnia and HerzegovinaBotswanaBrazilBurkina FasoBurundiCabo VerdeCambodiaCameroonCaribbean small statesCentral African RepublicCentral Europe and the BalticsChadChileChinaColombiaComorosCongo, Dem. Rep.Congo, Rep.Costa RicaCote d'IvoireCubaCyprusDjiboutiDominicaDominican RepublicEast Asia & PacificEast Asia & Pacific (excluding high income)East Asia & Pacific (IDA & IBRD countries)EcuadorEgypt, Arab Rep.El SalvadorEquatorial GuineaEritreaEthiopiaEuro areaEurope & Central AsiaEurope & Central Asia (excluding high income)Europe & Central Asia (IDA & IBRD countries)European UnionFragile and conflict affected situationsGabonGambia, TheGeorgiaGhanaGrenadaGuatemalaGuineaGuinea-BissauGuyanaHaitiHeavily indebted poor countries (HIPC)High incomeHondurasIBRD onlyIDA & IBRD totalIDA blendIDA onlyIDA totalIndiaIndonesiaIraqJamaicaJordanKenyaKorea, Dem. People’s Rep.Kyrgyz RepublicLao PDRLatin America & Caribbean Latin America & Caribbean (excluding high income)Latin America & the Caribbean (IDA & IBRD countries)Least developed countries: UN classificationLebanonLesothoLiberiaLow incomeLower middle incomeMacao SAR, ChinaMacedonia, FYRMadagascarMalawiMaldivesMaliMauritaniaMauritiusMexicoMiddle East & North AfricaMiddle East & North Africa (excluding high income)Middle East & North Africa (IDA & IBRD countries)MoldovaMongoliaMoroccoMozambiqueMyanmarNamibiaNepalNicaraguaNigerNigeriaOECD membersOther small statesPacific island small statesPakistanPanamaPapua New GuineaParaguayPeruPhilippinesRomaniaRwandaSamoaSao Tome and PrincipeSenegalSeychellesSierra LeoneSmall statesSolomon IslandsSomaliaSouth AsiaSouth Asia (IDA & IBRD)South SudanSri LankaSt. LuciaSt. Vincent and the GrenadinesSub-Saharan Africa Sub-Saharan Africa (excluding high income)Sub-Saharan Africa (IDA & IBRD countries)SudanSurinameSwazilandSyrian Arab RepublicTajikistanTanzaniaThailandTimor-LesteTogoTongaTunisiaTurkeyUgandaUpper middle incomeUruguayUzbekistanVenezuela, RBVietnamWest Bank and GazaWorldYemen, Rep.ZambiaZimbabwe

Zeitlinie:

Diese Zeitleiste vorliegt die Graphik ab 1984 J. bis 2015 J. Botswana. Die Angaben bis 1983 J. sind nicht vorhanden. Die Zahl aktueller Beobachtungen nach Daten: 19.

Die Quelle (Bezeichnung):

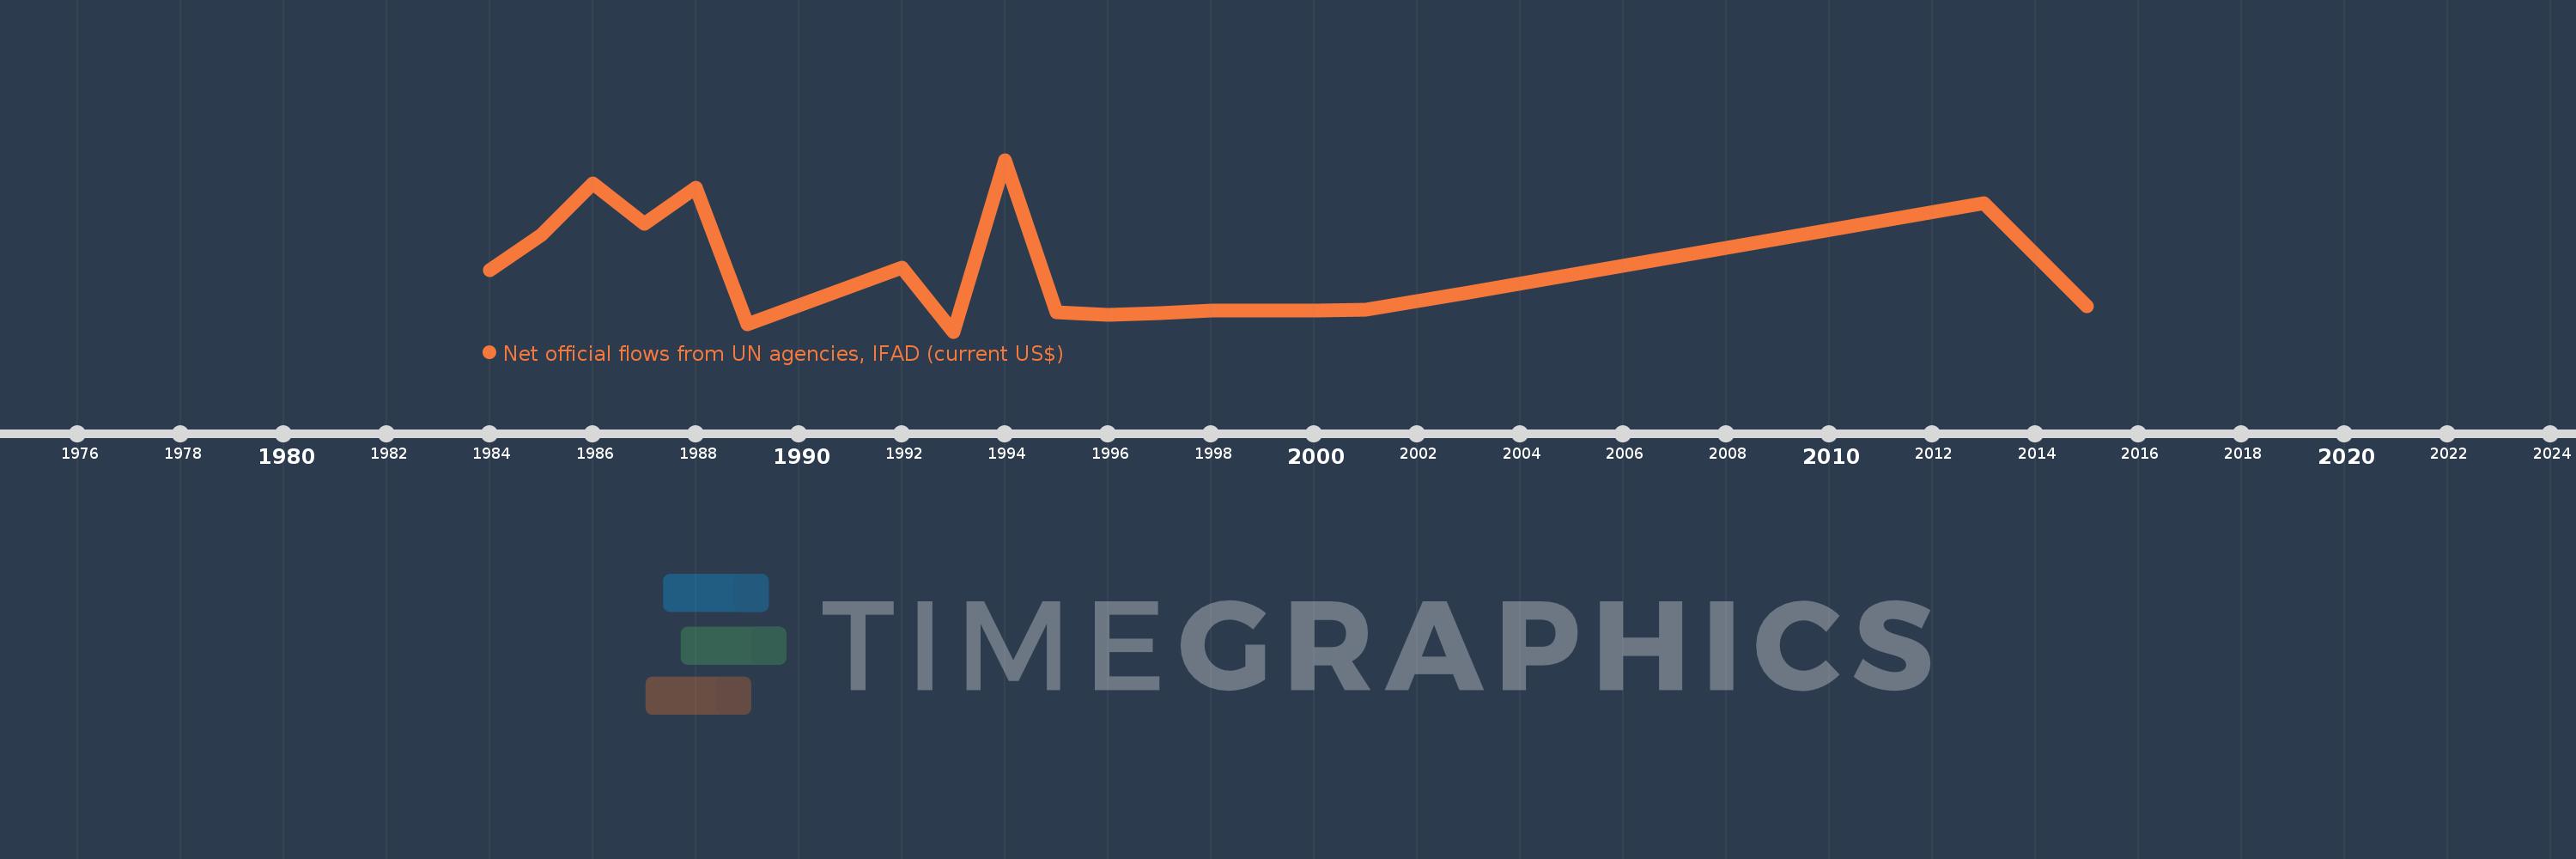
Kennzahlen der Weltentwicklung

Die Quelle (Einrichtung):

Development Assistance Committee of the Organisation for Economic Co-operation and Development, Geographical Distribution of Financial Flows to Developing Countries, Development Co-operation Report, and International Development Statistics database. Data are available online at: www.oecd.org/dac/stats/idsonline.

Kategorien:

Aid Effectiveness

Es wurde aktualisiert:

23 Apr 2017 Jahr

Kennzahlen der Wertänderungen vom Jahr zum Jahr

im Durchschnitt:
36.842 Tsnd.
Minimum:
-450.0 Tsnd.
1 Jan 1993 Jahr
Maximum:
950.0 Tsnd.
1 Jan 1994 Jahr
Zum Datum der Beobachtung
Wert
Absolute Veränderung
Die Veränderung bezüglich dem vorherigen Wert
1 Jan 1984 Jahr
50.0 Tsnd.
+50.0 Tsnd.
0.0%
1 Jan 1985 Jahr
340.0 Tsnd.
+290.0 Tsnd.
580.0%
1 Jan 1986 Jahr
760.0 Tsnd.
+420.0 Tsnd.
123.53%
1 Jan 1987 Jahr
430.0 Tsnd.
-330.0 Tsnd.
-43.42%
1 Jan 1988 Jahr
720.0 Tsnd.
+290.0 Tsnd.
67.44%
1 Jan 1989 Jahr
-390.0 Tsnd.
-1.11 Mln.
-154.17%
1 Jan 1992 Jahr
70.0 Tsnd.
+460.0 Tsnd.
-117.95%
1 Jan 1993 Jahr
-450.0 Tsnd.
-520.0 Tsnd.
-742.86%
1 Jan 1994 Jahr
950.0 Tsnd.
+1.4 Mln.
-311.11%
1 Jan 1995 Jahr
-290.0 Tsnd.
-1.24 Mln.
-130.53%
1 Jan 1996 Jahr
-310.0 Tsnd.
-20.0 Tsnd.
6.9%
1 Jan 1997 Jahr
-300.0 Tsnd.
+10.0 Tsnd.
-3.23%
1 Jan 1998 Jahr
-280.0 Tsnd.
+20.0 Tsnd.
-6.67%
1 Jan 1999 Jahr
-280.0 Tsnd.
0.0
0.0%
1 Jan 2000 Jahr
-280.0 Tsnd.
0.0
0.0%
1 Jan 2001 Jahr
-270.0 Tsnd.
+10.0 Tsnd.
-3.57%
1 Jan 2003 Jahr
-130.0 Tsnd.
+140.0 Tsnd.
-51.85%
1 Jan 2013 Jahr
600.0 Tsnd.
+730.0 Tsnd.
-561.54%
1 Jan 2015 Jahr
-240.0 Tsnd.
-840.0 Tsnd.
-140.0%

Bewertung der Länder gemäß mit laufender Statistik nach Jahren