33
/de/
AIzaSyAYiBZKx7MnpbEhh9jyipgxe19OcubqV5w
August 1, 2025
184274
Macedonia, FYR
MKD
true
2
1
Net official flows from UN agencies, IFAD (current US$)
2015,2014,2013,2012,2011,2010,2008,2007,2006,2005,2004,2003,2002,2001,2000,1999
Download
Bibliothek der Globalstatistik →Macedonia, FYR →

Net official flows from UN agencies, IFAD (current US$)

Diese Statistik in anderen Ländern:

AfghanistanAlbaniaAlgeriaAngolaArab WorldArgentinaArmeniaAzerbaijanBangladeshBelizeBeninBhutanBoliviaBosnia and HerzegovinaBotswanaBrazilBurkina FasoBurundiCabo VerdeCambodiaCameroonCaribbean small statesCentral African RepublicCentral Europe and the BalticsChadChileChinaColombiaComorosCongo, Dem. Rep.Congo, Rep.Costa RicaCote d'IvoireCubaCyprusDjiboutiDominicaDominican RepublicEast Asia & PacificEast Asia & Pacific (excluding high income)East Asia & Pacific (IDA & IBRD countries)EcuadorEgypt, Arab Rep.El SalvadorEquatorial GuineaEritreaEthiopiaEuro areaEurope & Central AsiaEurope & Central Asia (excluding high income)Europe & Central Asia (IDA & IBRD countries)European UnionFragile and conflict affected situationsGabonGambia, TheGeorgiaGhanaGrenadaGuatemalaGuineaGuinea-BissauGuyanaHaitiHeavily indebted poor countries (HIPC)High incomeHondurasIBRD onlyIDA & IBRD totalIDA blendIDA onlyIDA totalIndiaIndonesiaIraqJamaicaJordanKenyaKorea, Dem. People’s Rep.Kyrgyz RepublicLao PDRLatin America & Caribbean Latin America & Caribbean (excluding high income)Latin America & the Caribbean (IDA & IBRD countries)Least developed countries: UN classificationLebanonLesothoLiberiaLow incomeLower middle incomeMacao SAR, ChinaMacedonia, FYRMadagascarMalawiMaldivesMaliMauritaniaMauritiusMexicoMiddle East & North AfricaMiddle East & North Africa (excluding high income)Middle East & North Africa (IDA & IBRD countries)MoldovaMongoliaMoroccoMozambiqueMyanmarNamibiaNepalNicaraguaNigerNigeriaOECD membersOther small statesPacific island small statesPakistanPanamaPapua New GuineaParaguayPeruPhilippinesRomaniaRwandaSamoaSao Tome and PrincipeSenegalSeychellesSierra LeoneSmall statesSolomon IslandsSomaliaSouth AsiaSouth Asia (IDA & IBRD)South SudanSri LankaSt. LuciaSt. Vincent and the GrenadinesSub-Saharan Africa Sub-Saharan Africa (excluding high income)Sub-Saharan Africa (IDA & IBRD countries)SudanSurinameSwazilandSyrian Arab RepublicTajikistanTanzaniaThailandTimor-LesteTogoTongaTunisiaTurkeyUgandaUpper middle incomeUruguayUzbekistanVenezuela, RBVietnamWest Bank and GazaWorldYemen, Rep.ZambiaZimbabwe

Zeitlinie:

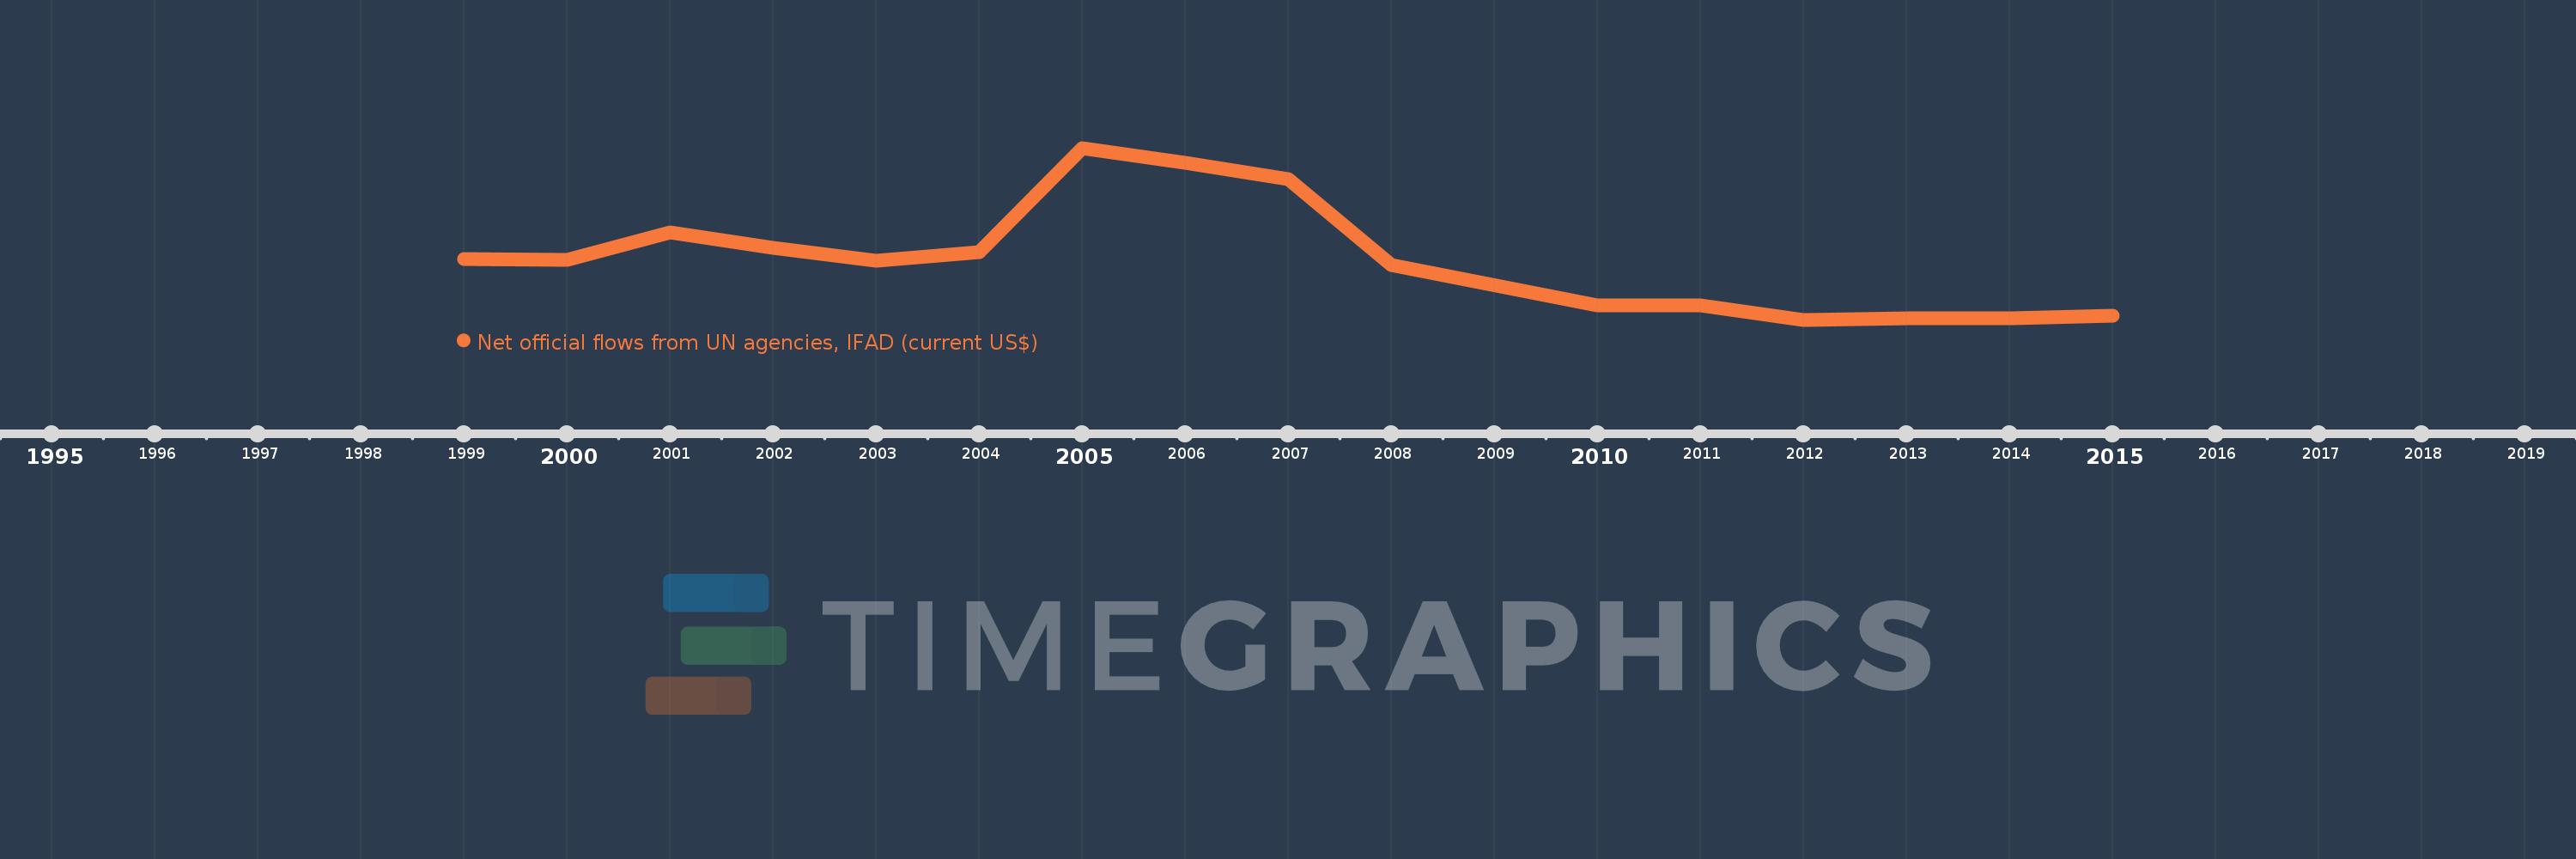
Diese Zeitleiste vorliegt die Graphik ab 1999 J. bis 2015 J. Macedonia, FYR. Die Angaben bis 1998 J. sind nicht vorhanden. Die Zahl aktueller Beobachtungen nach Daten: 16.

Die Quelle (Bezeichnung):

Kennzahlen der Weltentwicklung

Die Quelle (Einrichtung):

Development Assistance Committee of the Organisation for Economic Co-operation and Development, Geographical Distribution of Financial Flows to Developing Countries, Development Co-operation Report, and International Development Statistics database. Data are available online at: www.oecd.org/dac/stats/idsonline.

Kategorien:

Aid Effectiveness

Es wurde aktualisiert:

23 Apr 2017 Jahr

Kennzahlen der Wertänderungen vom Jahr zum Jahr

im Durchschnitt:
825.625 Tsnd.
Minimum:
-630.0 Tsnd.
1 Jan 2012 Jahr
Maximum:
3.51 Mln.
1 Jan 2005 Jahr
Zum Datum der Beobachtung
Wert
Absolute Veränderung
Die Veränderung bezüglich dem vorherigen Wert
1 Jan 1999 Jahr
840.0 Tsnd.
+840.0 Tsnd.
0.0%
1 Jan 2000 Jahr
820.0 Tsnd.
-20.0 Tsnd.
-2.38%
1 Jan 2001 Jahr
1.47 Mln.
+650.0 Tsnd.
79.27%
1 Jan 2002 Jahr
1.11 Mln.
-360.0 Tsnd.
-24.49%
1 Jan 2003 Jahr
800.0 Tsnd.
-310.0 Tsnd.
-27.93%
1 Jan 2004 Jahr
1000.0 Tsnd.
+200.0 Tsnd.
25.0%
1 Jan 2005 Jahr
3.51 Mln.
+2.51 Mln.
251.0%
1 Jan 2006 Jahr
3.16 Mln.
-350.0 Tsnd.
-9.97%
1 Jan 2007 Jahr
2.75 Mln.
-410.0 Tsnd.
-12.97%
1 Jan 2008 Jahr
680.0 Tsnd.
-2.07 Mln.
-75.27%
1 Jan 2010 Jahr
-290.0 Tsnd.
-970.0 Tsnd.
-142.65%
1 Jan 2011 Jahr
-280.0 Tsnd.
+10.0 Tsnd.
-3.45%
1 Jan 2012 Jahr
-630.0 Tsnd.
-350.0 Tsnd.
125.0%
1 Jan 2013 Jahr
-600.0 Tsnd.
+30.0 Tsnd.
-4.76%
1 Jan 2014 Jahr
-590.0 Tsnd.
+10.0 Tsnd.
-1.67%
1 Jan 2015 Jahr
-540.0 Tsnd.
+50.0 Tsnd.
-8.47%

Bewertung der Länder gemäß mit laufender Statistik nach Jahren