33
/de/
AIzaSyAYiBZKx7MnpbEhh9jyipgxe19OcubqV5w
August 1, 2025
199547
Mongolia
MNG
true
2
1
Net official flows from UN agencies, IFAD (current US$)
2015,2014,2013,2012,2011,2010,2009,2008,2007,2006,2005,2004,2003,2002,2001,2000,1999,1998
Download
Bibliothek der Globalstatistik →Mongolia →

Net official flows from UN agencies, IFAD (current US$)

Diese Statistik in anderen Ländern:

AfghanistanAlbaniaAlgeriaAngolaArab WorldArgentinaArmeniaAzerbaijanBangladeshBelizeBeninBhutanBoliviaBosnia and HerzegovinaBotswanaBrazilBurkina FasoBurundiCabo VerdeCambodiaCameroonCaribbean small statesCentral African RepublicCentral Europe and the BalticsChadChileChinaColombiaComorosCongo, Dem. Rep.Congo, Rep.Costa RicaCote d'IvoireCubaCyprusDjiboutiDominicaDominican RepublicEast Asia & PacificEast Asia & Pacific (excluding high income)East Asia & Pacific (IDA & IBRD countries)EcuadorEgypt, Arab Rep.El SalvadorEquatorial GuineaEritreaEthiopiaEuro areaEurope & Central AsiaEurope & Central Asia (excluding high income)Europe & Central Asia (IDA & IBRD countries)European UnionFragile and conflict affected situationsGabonGambia, TheGeorgiaGhanaGrenadaGuatemalaGuineaGuinea-BissauGuyanaHaitiHeavily indebted poor countries (HIPC)High incomeHondurasIBRD onlyIDA & IBRD totalIDA blendIDA onlyIDA totalIndiaIndonesiaIraqJamaicaJordanKenyaKorea, Dem. People’s Rep.Kyrgyz RepublicLao PDRLatin America & Caribbean Latin America & Caribbean (excluding high income)Latin America & the Caribbean (IDA & IBRD countries)Least developed countries: UN classificationLebanonLesothoLiberiaLow incomeLower middle incomeMacao SAR, ChinaMacedonia, FYRMadagascarMalawiMaldivesMaliMauritaniaMauritiusMexicoMiddle East & North AfricaMiddle East & North Africa (excluding high income)Middle East & North Africa (IDA & IBRD countries)MoldovaMongoliaMoroccoMozambiqueMyanmarNamibiaNepalNicaraguaNigerNigeriaOECD membersOther small statesPacific island small statesPakistanPanamaPapua New GuineaParaguayPeruPhilippinesRomaniaRwandaSamoaSao Tome and PrincipeSenegalSeychellesSierra LeoneSmall statesSolomon IslandsSomaliaSouth AsiaSouth Asia (IDA & IBRD)South SudanSri LankaSt. LuciaSt. Vincent and the GrenadinesSub-Saharan Africa Sub-Saharan Africa (excluding high income)Sub-Saharan Africa (IDA & IBRD countries)SudanSurinameSwazilandSyrian Arab RepublicTajikistanTanzaniaThailandTimor-LesteTogoTongaTunisiaTurkeyUgandaUpper middle incomeUruguayUzbekistanVenezuela, RBVietnamWest Bank and GazaWorldYemen, Rep.ZambiaZimbabwe

Zeitlinie:

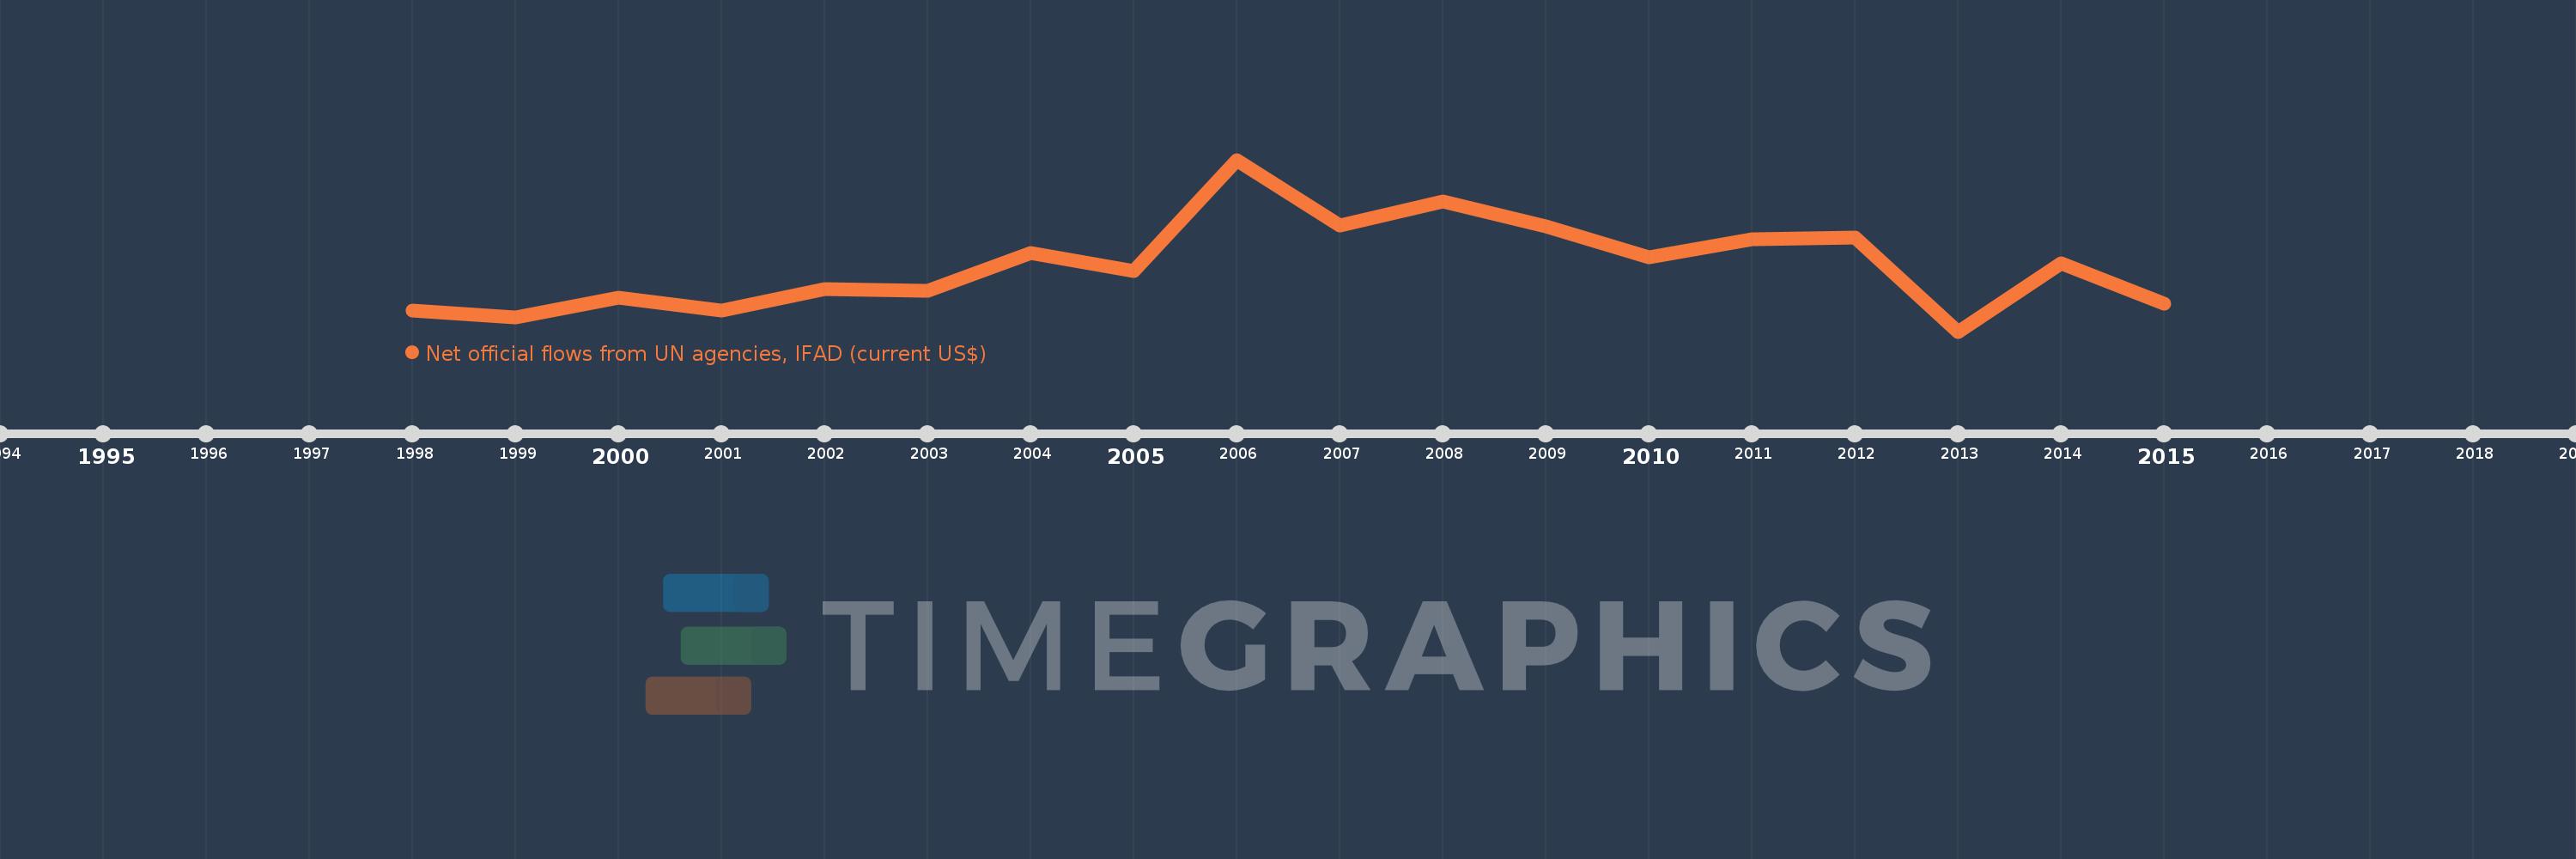
Diese Zeitleiste vorliegt die Graphik ab 1998 J. bis 2015 J. Mongolia. Die Angaben bis 1997 J. sind nicht vorhanden. Die Zahl aktueller Beobachtungen nach Daten: 18.

Die Quelle (Bezeichnung):

Kennzahlen der Weltentwicklung

Die Quelle (Einrichtung):

Development Assistance Committee of the Organisation for Economic Co-operation and Development, Geographical Distribution of Financial Flows to Developing Countries, Development Co-operation Report, and International Development Statistics database. Data are available online at: www.oecd.org/dac/stats/idsonline.

Kategorien:

Aid Effectiveness

Es wurde aktualisiert:

23 Apr 2017 Jahr

Kennzahlen der Wertänderungen vom Jahr zum Jahr

im Durchschnitt:
1.234 Mln.
Minimum:
-130.0 Tsnd.
1 Jan 2013 Jahr
Maximum:
3.44 Mln.
1 Jan 2006 Jahr
Zum Datum der Beobachtung
Wert
Absolute Veränderung
Die Veränderung bezüglich dem vorherigen Wert
1 Jan 1998 Jahr
300.0 Tsnd.
+300.0 Tsnd.
0.0%
1 Jan 1999 Jahr
170.0 Tsnd.
-130.0 Tsnd.
-43.33%
1 Jan 2000 Jahr
570.0 Tsnd.
+400.0 Tsnd.
235.29%
1 Jan 2001 Jahr
300.0 Tsnd.
-270.0 Tsnd.
-47.37%
1 Jan 2002 Jahr
750.0 Tsnd.
+450.0 Tsnd.
150.0%
1 Jan 2003 Jahr
710.0 Tsnd.
-40.0 Tsnd.
-5.33%
1 Jan 2004 Jahr
1.5 Mln.
+790.0 Tsnd.
111.27%
1 Jan 2005 Jahr
1.12 Mln.
-380.0 Tsnd.
-25.33%
1 Jan 2006 Jahr
3.44 Mln.
+2.32 Mln.
207.14%
1 Jan 2007 Jahr
2.08 Mln.
-1.36 Mln.
-39.53%
1 Jan 2008 Jahr
2.58 Mln.
+500.0 Tsnd.
24.04%
1 Jan 2009 Jahr
2.06 Mln.
-520.0 Tsnd.
-20.16%
1 Jan 2010 Jahr
1.42 Mln.
-640.0 Tsnd.
-31.07%
1 Jan 2011 Jahr
1.78 Mln.
+360.0 Tsnd.
25.35%
1 Jan 2012 Jahr
1.82 Mln.
+40.0 Tsnd.
2.25%
1 Jan 2013 Jahr
-130.0 Tsnd.
-1.95 Mln.
-107.14%
1 Jan 2014 Jahr
1.29 Mln.
+1.42 Mln.
-1.09 Tsnd.%
1 Jan 2015 Jahr
450.0 Tsnd.
-840.0 Tsnd.
-65.12%

Bewertung der Länder gemäß mit laufender Statistik nach Jahren