33
/de/
AIzaSyAYiBZKx7MnpbEhh9jyipgxe19OcubqV5w
August 1, 2025
147187
Guinea-Bissau
GNB
true
2
1
Net official flows from UN agencies, IFAD (current US$)
2015,2014,2013,2012,2011,2010,2008,2001,1999,1998,1997,1996,1995,1994,1993,1992,1991,1990,1989,1988,1987
Download
Bibliothek der Globalstatistik →Guinea-Bissau →

Net official flows from UN agencies, IFAD (current US$)

Diese Statistik in anderen Ländern:

AfghanistanAlbaniaAlgeriaAngolaArab WorldArgentinaArmeniaAzerbaijanBangladeshBelizeBeninBhutanBoliviaBosnia and HerzegovinaBotswanaBrazilBurkina FasoBurundiCabo VerdeCambodiaCameroonCaribbean small statesCentral African RepublicCentral Europe and the BalticsChadChileChinaColombiaComorosCongo, Dem. Rep.Congo, Rep.Costa RicaCote d'IvoireCubaCyprusDjiboutiDominicaDominican RepublicEast Asia & PacificEast Asia & Pacific (excluding high income)East Asia & Pacific (IDA & IBRD countries)EcuadorEgypt, Arab Rep.El SalvadorEquatorial GuineaEritreaEthiopiaEuro areaEurope & Central AsiaEurope & Central Asia (excluding high income)Europe & Central Asia (IDA & IBRD countries)European UnionFragile and conflict affected situationsGabonGambia, TheGeorgiaGhanaGrenadaGuatemalaGuineaGuinea-BissauGuyanaHaitiHeavily indebted poor countries (HIPC)High incomeHondurasIBRD onlyIDA & IBRD totalIDA blendIDA onlyIDA totalIndiaIndonesiaIraqJamaicaJordanKenyaKorea, Dem. People’s Rep.Kyrgyz RepublicLao PDRLatin America & Caribbean Latin America & Caribbean (excluding high income)Latin America & the Caribbean (IDA & IBRD countries)Least developed countries: UN classificationLebanonLesothoLiberiaLow incomeLower middle incomeMacao SAR, ChinaMacedonia, FYRMadagascarMalawiMaldivesMaliMauritaniaMauritiusMexicoMiddle East & North AfricaMiddle East & North Africa (excluding high income)Middle East & North Africa (IDA & IBRD countries)MoldovaMongoliaMoroccoMozambiqueMyanmarNamibiaNepalNicaraguaNigerNigeriaOECD membersOther small statesPacific island small statesPakistanPanamaPapua New GuineaParaguayPeruPhilippinesRomaniaRwandaSamoaSao Tome and PrincipeSenegalSeychellesSierra LeoneSmall statesSolomon IslandsSomaliaSouth AsiaSouth Asia (IDA & IBRD)South SudanSri LankaSt. LuciaSt. Vincent and the GrenadinesSub-Saharan Africa Sub-Saharan Africa (excluding high income)Sub-Saharan Africa (IDA & IBRD countries)SudanSurinameSwazilandSyrian Arab RepublicTajikistanTanzaniaThailandTimor-LesteTogoTongaTunisiaTurkeyUgandaUpper middle incomeUruguayUzbekistanVenezuela, RBVietnamWest Bank and GazaWorldYemen, Rep.ZambiaZimbabwe

Zeitlinie:

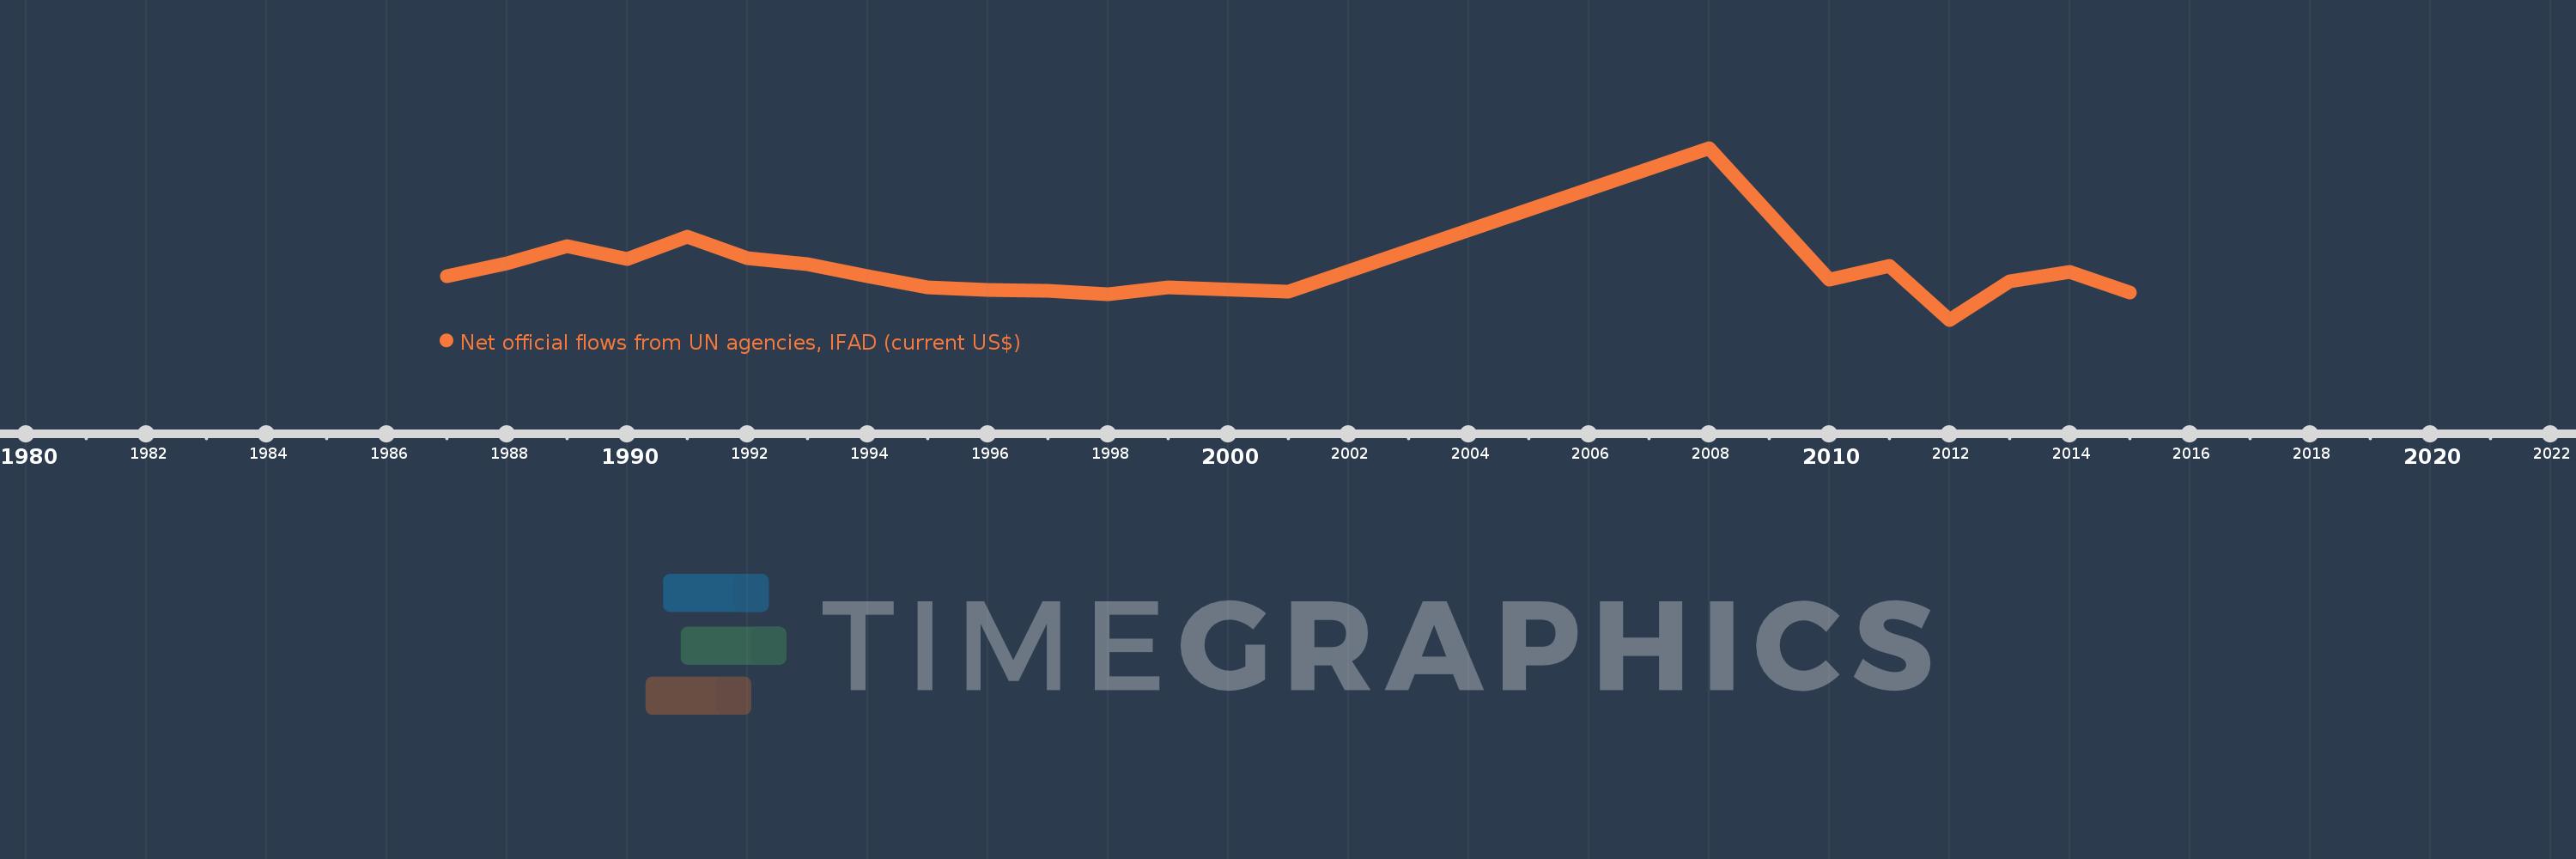
Diese Zeitleiste vorliegt die Graphik ab 1987 J. bis 2015 J. Guinea-Bissau. Die Angaben bis 1986 J. sind nicht vorhanden. Die Zahl aktueller Beobachtungen nach Daten: 21.

Die Quelle (Bezeichnung):

Kennzahlen der Weltentwicklung

Die Quelle (Einrichtung):

Development Assistance Committee of the Organisation for Economic Co-operation and Development, Geographical Distribution of Financial Flows to Developing Countries, Development Co-operation Report, and International Development Statistics database. Data are available online at: www.oecd.org/dac/stats/idsonline.

Kategorien:

Aid Effectiveness

Es wurde aktualisiert:

23 Apr 2017 Jahr

Kennzahlen der Wertänderungen vom Jahr zum Jahr

im Durchschnitt:
543.81 Tsnd.
Minimum:
-1.12 Mln.
1 Jan 2012 Jahr
Maximum:
4.68 Mln.
1 Jan 2008 Jahr
Zum Datum der Beobachtung
Wert
Absolute Veränderung
Die Veränderung bezüglich dem vorherigen Wert
1 Jan 1987 Jahr
350.0 Tsnd.
+350.0 Tsnd.
0.0%
1 Jan 1988 Jahr
790.0 Tsnd.
+440.0 Tsnd.
125.71%
1 Jan 1989 Jahr
1.37 Mln.
+580.0 Tsnd.
73.42%
1 Jan 1990 Jahr
920.0 Tsnd.
-450.0 Tsnd.
-32.85%
1 Jan 1991 Jahr
1.68 Mln.
+760.0 Tsnd.
82.61%
1 Jan 1992 Jahr
970.0 Tsnd.
-710.0 Tsnd.
-42.26%
1 Jan 1993 Jahr
750.0 Tsnd.
-220.0 Tsnd.
-22.68%
1 Jan 1994 Jahr
360.0 Tsnd.
-390.0 Tsnd.
-52.0%
1 Jan 1995 Jahr
-40.0 Tsnd.
-400.0 Tsnd.
-111.11%
1 Jan 1996 Jahr
-120.0 Tsnd.
-80.0 Tsnd.
200.0%
1 Jan 1997 Jahr
-150.0 Tsnd.
-30.0 Tsnd.
25.0%
1 Jan 1998 Jahr
-250.0 Tsnd.
-100.0 Tsnd.
66.67%
1 Jan 1999 Jahr
-30.0 Tsnd.
+220.0 Tsnd.
-88.0%
1 Jan 2001 Jahr
-170.0 Tsnd.
-140.0 Tsnd.
466.67%
1 Jan 2008 Jahr
4.68 Mln.
+4.85 Mln.
-2.85 Tsnd.%
1 Jan 2010 Jahr
240.0 Tsnd.
-4.44 Mln.
-94.87%
1 Jan 2011 Jahr
700.0 Tsnd.
+460.0 Tsnd.
191.67%
1 Jan 2012 Jahr
-1.12 Mln.
-1.82 Mln.
-260.0%
1 Jan 2013 Jahr
180.0 Tsnd.
+1.3 Mln.
-116.07%
1 Jan 2014 Jahr
500.0 Tsnd.
+320.0 Tsnd.
177.78%
1 Jan 2015 Jahr
-190.0 Tsnd.
-690.0 Tsnd.
-138.0%

Bewertung der Länder gemäß mit laufender Statistik nach Jahren