33
/de/
AIzaSyAYiBZKx7MnpbEhh9jyipgxe19OcubqV5w
August 1, 2025
68113
Angola
AGO
true
2
1
Net official flows from UN agencies, IFAD (current US$)
2015,2014,2013,2012,2011,2010,2009,2008,2007,2006,2005,2004,2003,2002,2001,2000,1999,1998
Download
Bibliothek der Globalstatistik →Angola →

Net official flows from UN agencies, IFAD (current US$)

Diese Statistik in anderen Ländern:

AfghanistanAlbaniaAlgeriaAngolaArab WorldArgentinaArmeniaAzerbaijanBangladeshBelizeBeninBhutanBoliviaBosnia and HerzegovinaBotswanaBrazilBurkina FasoBurundiCabo VerdeCambodiaCameroonCaribbean small statesCentral African RepublicCentral Europe and the BalticsChadChileChinaColombiaComorosCongo, Dem. Rep.Congo, Rep.Costa RicaCote d'IvoireCubaCyprusDjiboutiDominicaDominican RepublicEast Asia & PacificEast Asia & Pacific (excluding high income)East Asia & Pacific (IDA & IBRD countries)EcuadorEgypt, Arab Rep.El SalvadorEquatorial GuineaEritreaEthiopiaEuro areaEurope & Central AsiaEurope & Central Asia (excluding high income)Europe & Central Asia (IDA & IBRD countries)European UnionFragile and conflict affected situationsGabonGambia, TheGeorgiaGhanaGrenadaGuatemalaGuineaGuinea-BissauGuyanaHaitiHeavily indebted poor countries (HIPC)High incomeHondurasIBRD onlyIDA & IBRD totalIDA blendIDA onlyIDA totalIndiaIndonesiaIraqJamaicaJordanKenyaKorea, Dem. People’s Rep.Kyrgyz RepublicLao PDRLatin America & Caribbean Latin America & Caribbean (excluding high income)Latin America & the Caribbean (IDA & IBRD countries)Least developed countries: UN classificationLebanonLesothoLiberiaLow incomeLower middle incomeMacao SAR, ChinaMacedonia, FYRMadagascarMalawiMaldivesMaliMauritaniaMauritiusMexicoMiddle East & North AfricaMiddle East & North Africa (excluding high income)Middle East & North Africa (IDA & IBRD countries)MoldovaMongoliaMoroccoMozambiqueMyanmarNamibiaNepalNicaraguaNigerNigeriaOECD membersOther small statesPacific island small statesPakistanPanamaPapua New GuineaParaguayPeruPhilippinesRomaniaRwandaSamoaSao Tome and PrincipeSenegalSeychellesSierra LeoneSmall statesSolomon IslandsSomaliaSouth AsiaSouth Asia (IDA & IBRD)South SudanSri LankaSt. LuciaSt. Vincent and the GrenadinesSub-Saharan Africa Sub-Saharan Africa (excluding high income)Sub-Saharan Africa (IDA & IBRD countries)SudanSurinameSwazilandSyrian Arab RepublicTajikistanTanzaniaThailandTimor-LesteTogoTongaTunisiaTurkeyUgandaUpper middle incomeUruguayUzbekistanVenezuela, RBVietnamWest Bank and GazaWorldYemen, Rep.ZambiaZimbabwe

Zeitlinie:

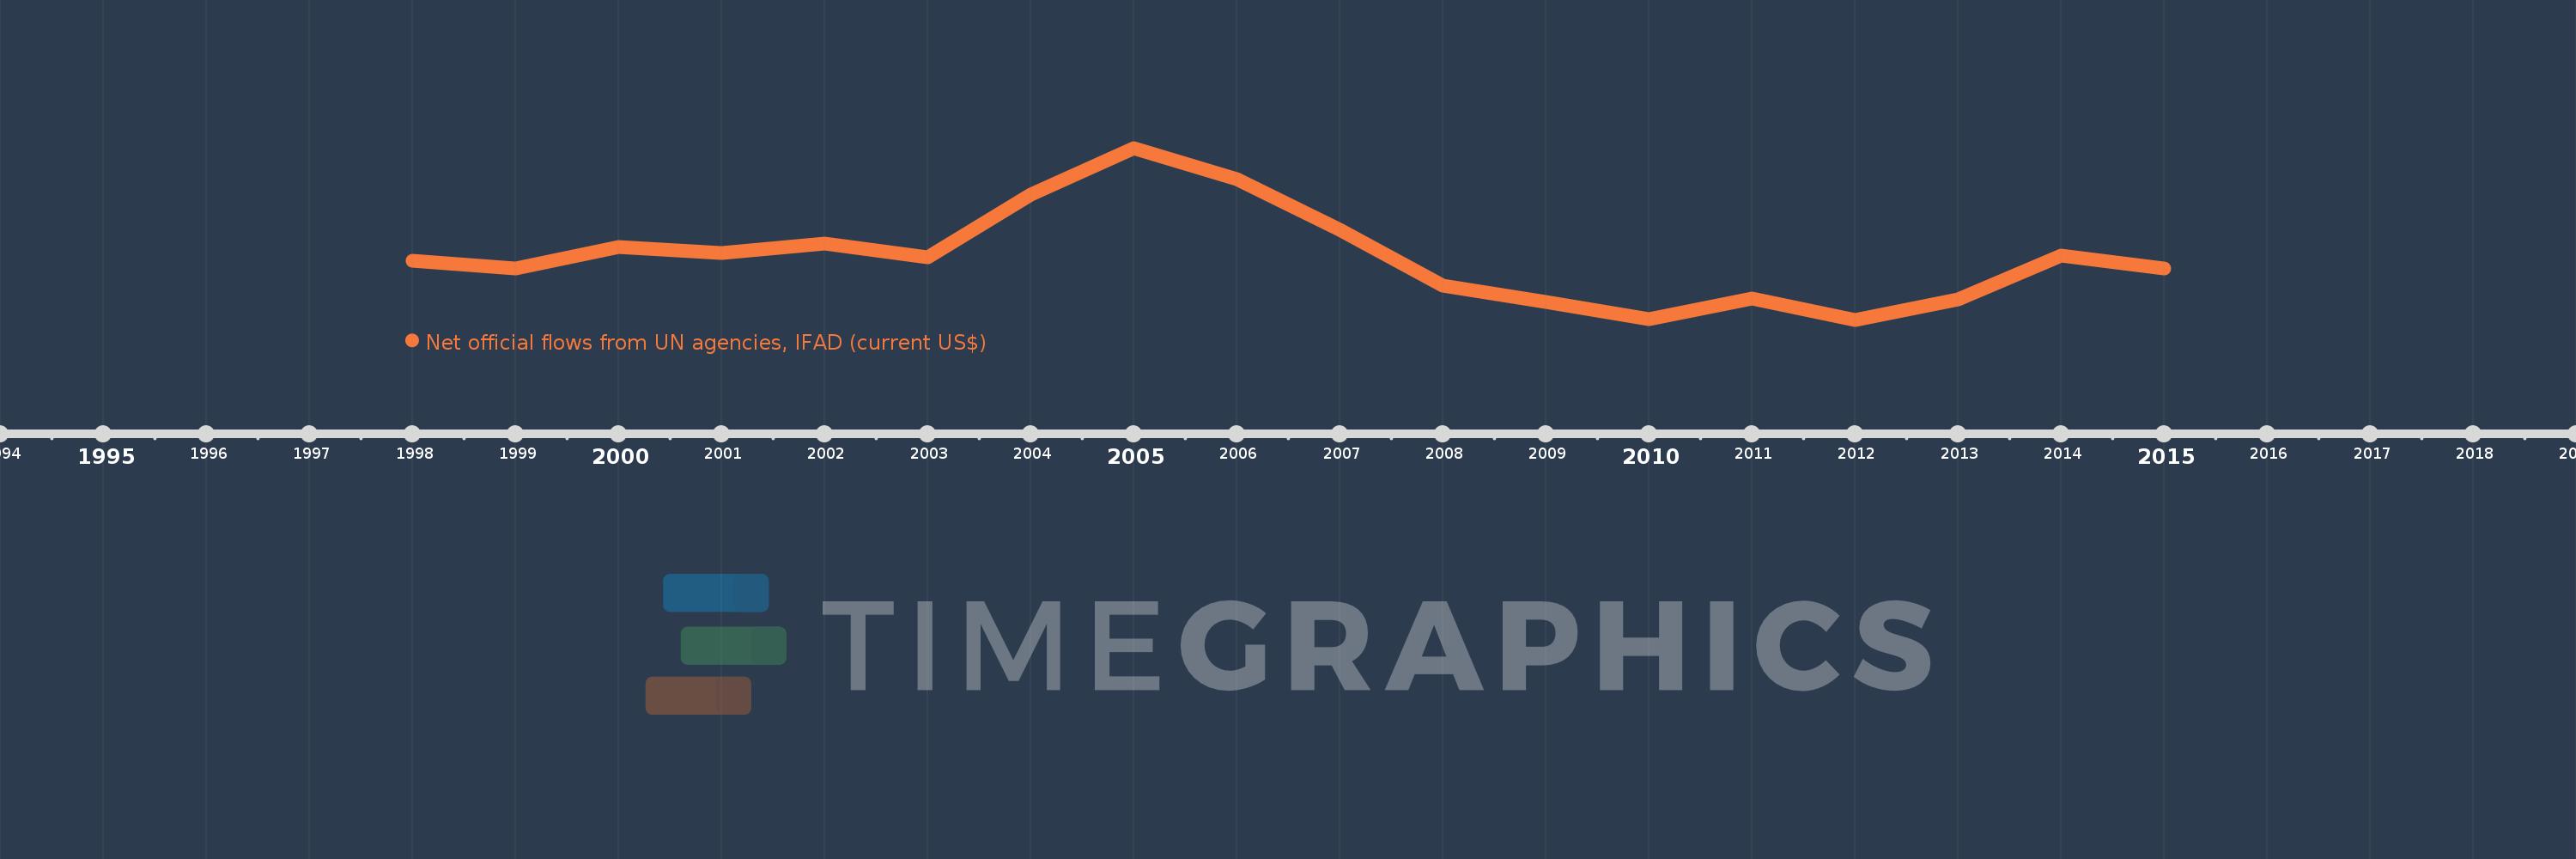
Diese Zeitleiste vorliegt die Graphik ab 1998 J. bis 2015 J. Angola. Die Angaben bis 1997 J. sind nicht vorhanden. Die Zahl aktueller Beobachtungen nach Daten: 18.

Die Quelle (Bezeichnung):

Kennzahlen der Weltentwicklung

Die Quelle (Einrichtung):

Development Assistance Committee of the Organisation for Economic Co-operation and Development, Geographical Distribution of Financial Flows to Developing Countries, Development Co-operation Report, and International Development Statistics database. Data are available online at: www.oecd.org/dac/stats/idsonline.

Kategorien:

Aid Effectiveness

Es wurde aktualisiert:

23 Apr 2017 Jahr

Kennzahlen der Wertänderungen vom Jahr zum Jahr

im Durchschnitt:
949.444 Tsnd.
Minimum:
-770.0 Tsnd.
1 Jan 2012 Jahr
Maximum:
3.95 Mln.
1 Jan 2005 Jahr
Zum Datum der Beobachtung
Wert
Absolute Veränderung
Die Veränderung bezüglich dem vorherigen Wert
1 Jan 1998 Jahr
860.0 Tsnd.
+860.0 Tsnd.
0.0%
1 Jan 1999 Jahr
630.0 Tsnd.
-230.0 Tsnd.
-26.74%
1 Jan 2000 Jahr
1.22 Mln.
+590.0 Tsnd.
93.65%
1 Jan 2001 Jahr
1.07 Mln.
-150.0 Tsnd.
-12.3%
1 Jan 2002 Jahr
1.33 Mln.
+260.0 Tsnd.
24.3%
1 Jan 2003 Jahr
950.0 Tsnd.
-380.0 Tsnd.
-28.57%
1 Jan 2004 Jahr
2.66 Mln.
+1.71 Mln.
180.0%
1 Jan 2005 Jahr
3.95 Mln.
+1.29 Mln.
48.5%
1 Jan 2006 Jahr
3.1 Mln.
-850.0 Tsnd.
-21.52%
1 Jan 2007 Jahr
1.71 Mln.
-1.39 Mln.
-44.84%
1 Jan 2008 Jahr
160.0 Tsnd.
-1.55 Mln.
-90.64%
1 Jan 2009 Jahr
-290.0 Tsnd.
-450.0 Tsnd.
-281.25%
1 Jan 2010 Jahr
-750.0 Tsnd.
-460.0 Tsnd.
158.62%
1 Jan 2011 Jahr
-180.0 Tsnd.
+570.0 Tsnd.
-76.0%
1 Jan 2012 Jahr
-770.0 Tsnd.
-590.0 Tsnd.
327.78%
1 Jan 2013 Jahr
-200.0 Tsnd.
+570.0 Tsnd.
-74.03%
1 Jan 2014 Jahr
1000.0 Tsnd.
+1.2 Mln.
-600.0%
1 Jan 2015 Jahr
640.0 Tsnd.
-360.0 Tsnd.
-36.0%

Bewertung der Länder gemäß mit laufender Statistik nach Jahren