29
/de/
de
AIzaSyAYiBZKx7MnpbEhh9jyipgxe19OcubqV5w
April 1, 2024
135892
Gabon
GAB
true
2
1
Net official flows from UN agencies, IFAD (current US$)
2015,2014,2013,2012,2011,2010,2009,2008,2007,2006,2005,2004,2003,2002,2001,2000,1999,1998,1997,1996
Download
Bibliothek der Globalstatistik →Gabon →

Net official flows from UN agencies, IFAD (current US$)

Diese Statistik in anderen Ländern:
AfghanistanAlbaniaAlgeriaAngolaArab WorldArgentinaArmeniaAzerbaijanBangladeshBelizeBeninBhutanBoliviaBosnia and HerzegovinaBotswanaBrazilBurkina FasoBurundiCabo VerdeCambodiaCameroonCaribbean small statesCentral African RepublicCentral Europe and the BalticsChadChileChinaColombiaComorosCongo, Dem. Rep.Congo, Rep.Costa RicaCote d'IvoireCubaCyprusDjiboutiDominicaDominican RepublicEast Asia & PacificEast Asia & Pacific (excluding high income)East Asia & Pacific (IDA & IBRD countries)EcuadorEgypt, Arab Rep.El SalvadorEquatorial GuineaEritreaEthiopiaEuro areaEurope & Central AsiaEurope & Central Asia (excluding high income)Europe & Central Asia (IDA & IBRD countries)European UnionFragile and conflict affected situationsGabonGambia, TheGeorgiaGhanaGrenadaGuatemalaGuineaGuinea-BissauGuyanaHaitiHeavily indebted poor countries (HIPC)High incomeHondurasIBRD onlyIDA & IBRD totalIDA blendIDA onlyIDA totalIndiaIndonesiaIraqJamaicaJordanKenyaKorea, Dem. People’s Rep.Kyrgyz RepublicLao PDRLatin America & Caribbean Latin America & Caribbean (excluding high income)Latin America & the Caribbean (IDA & IBRD countries)Least developed countries: UN classificationLebanonLesothoLiberiaLow incomeLower middle incomeMacao SAR, ChinaMacedonia, FYRMadagascarMalawiMaldivesMaliMauritaniaMauritiusMexicoMiddle East & North AfricaMiddle East & North Africa (excluding high income)Middle East & North Africa (IDA & IBRD countries)MoldovaMongoliaMoroccoMozambiqueMyanmarNamibiaNepalNicaraguaNigerNigeriaOECD membersOther small statesPacific island small statesPakistanPanamaPapua New GuineaParaguayPeruPhilippinesRomaniaRwandaSamoaSao Tome and PrincipeSenegalSeychellesSierra LeoneSmall statesSolomon IslandsSomaliaSouth AsiaSouth Asia (IDA & IBRD)South SudanSri LankaSt. LuciaSt. Vincent and the GrenadinesSub-Saharan Africa Sub-Saharan Africa (excluding high income)Sub-Saharan Africa (IDA & IBRD countries)SudanSurinameSwazilandSyrian Arab RepublicTajikistanTanzaniaThailandTimor-LesteTogoTongaTunisiaTurkeyUgandaUpper middle incomeUruguayUzbekistanVenezuela, RBVietnamWest Bank and GazaWorldYemen, Rep.ZambiaZimbabwe
Zeitlinie:
Diese Zeitleiste vorliegt die Graphik ab 1996 J. bis 2015 J. Gabon. Die Angaben bis 1995 J. sind nicht vorhanden. Die Zahl aktueller Beobachtungen nach Daten: 20.
Die Quelle (Bezeichnung):
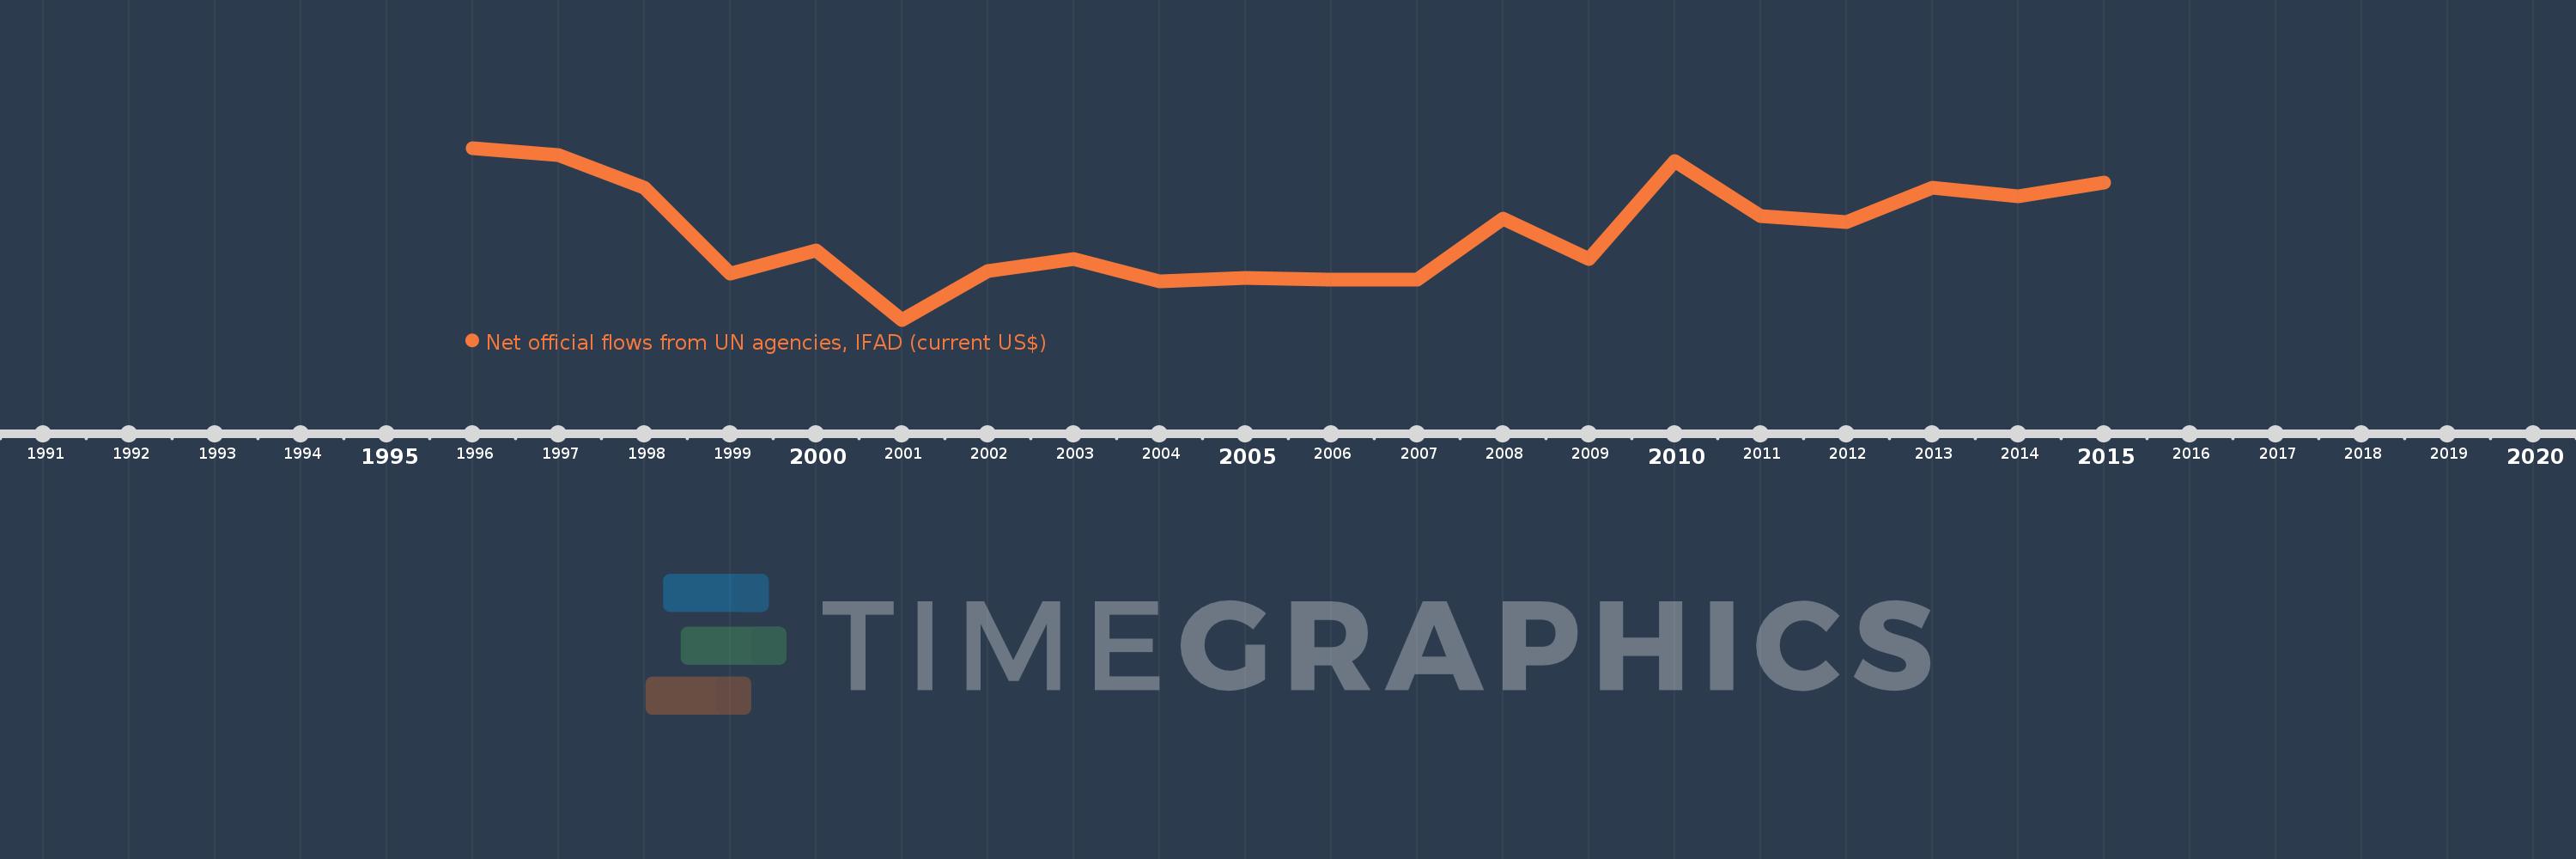
Kennzahlen der Weltentwicklung
Die Quelle (Einrichtung):
Development Assistance Committee of the Organisation for Economic Co-operation and Development, Geographical Distribution of Financial Flows to Developing Countries, Development Co-operation Report, and International Development Statistics database. Data are available online at: www.oecd.org/dac/stats/idsonline.
Kategorien:
Aid Effectiveness
Es wurde aktualisiert:
23 Apr 2017 Jahr
Kennzahlen der Wertänderungen vom Jahr zum Jahr
im Durchschnitt:
124.5 Tsnd.
Minimum:
-880.0 Tsnd.
1 Jan 2001 Jahr
Maximum:
1.07 Mln.
1 Jan 1996 Jahr
Zum Datum der Beobachtung
Wert
Absolute Veränderung
Die Veränderung bezüglich dem vorherigen Wert
1 Jan 1996 Jahr
1.07 Mln.
+1.07 Mln.
0.0%
1 Jan 1997 Jahr
990.0 Tsnd.
-80.0 Tsnd.
-7.48%
1 Jan 1998 Jahr
620.0 Tsnd.
-370.0 Tsnd.
-37.37%
1 Jan 1999 Jahr
-360.0 Tsnd.
-980.0 Tsnd.
-158.06%
1 Jan 2000 Jahr
-90.0 Tsnd.
+270.0 Tsnd.
-75.0%
1 Jan 2001 Jahr
-880.0 Tsnd.
-790.0 Tsnd.
877.78%
1 Jan 2002 Jahr
-330.0 Tsnd.
+550.0 Tsnd.
-62.5%
1 Jan 2003 Jahr
-190.0 Tsnd.
+140.0 Tsnd.
-42.42%
1 Jan 2004 Jahr
-440.0 Tsnd.
-250.0 Tsnd.
131.58%
1 Jan 2005 Jahr
-410.0 Tsnd.
+30.0 Tsnd.
-6.82%
1 Jan 2006 Jahr
-420.0 Tsnd.
-10.0 Tsnd.
2.44%
1 Jan 2007 Jahr
-420.0 Tsnd.
0.0
0.0%
1 Jan 2008 Jahr
270.0 Tsnd.
+690.0 Tsnd.
-164.29%
1 Jan 2009 Jahr
-190.0 Tsnd.
-460.0 Tsnd.
-170.37%
1 Jan 2010 Jahr
920.0 Tsnd.
+1.11 Mln.
-584.21%
1 Jan 2011 Jahr
300.0 Tsnd.
-620.0 Tsnd.
-67.39%
1 Jan 2012 Jahr
230.0 Tsnd.
-70.0 Tsnd.
-23.33%
1 Jan 2013 Jahr
620.0 Tsnd.
+390.0 Tsnd.
169.57%
1 Jan 2014 Jahr
520.0 Tsnd.
-100.0 Tsnd.
-16.13%
1 Jan 2015 Jahr
680.0 Tsnd.
+160.0 Tsnd.
30.77%
Bewertung der Länder gemäß mit laufender Statistik nach Jahren

Kommentare:

Abschicken
PremiumAbout & FeedbackVereinbarungPrivatheit
logo
© 2022 Selected Technologies LLC – Morgan Hill, California