30
/de/
AIzaSyAYiBZKx7MnpbEhh9jyipgxe19OcubqV5w
April 1, 2024
128626
Eritrea
ERI
true
2
1
Net official flows from UN agencies, IFAD (current US$)
2015,2014,2013,2012,2011,2010,2009,2008,2007,2006,2005,2004,2003,2002,2001,2000,1999,1998,1996
Download
Bibliothek der Globalstatistik →Eritrea →

Net official flows from UN agencies, IFAD (current US$)

Diese Statistik in anderen Ländern:

AfghanistanAlbaniaAlgeriaAngolaArab WorldArgentinaArmeniaAzerbaijanBangladeshBelizeBeninBhutanBoliviaBosnia and HerzegovinaBotswanaBrazilBurkina FasoBurundiCabo VerdeCambodiaCameroonCaribbean small statesCentral African RepublicCentral Europe and the BalticsChadChileChinaColombiaComorosCongo, Dem. Rep.Congo, Rep.Costa RicaCote d'IvoireCubaCyprusDjiboutiDominicaDominican RepublicEast Asia & PacificEast Asia & Pacific (excluding high income)East Asia & Pacific (IDA & IBRD countries)EcuadorEgypt, Arab Rep.El SalvadorEquatorial GuineaEritreaEthiopiaEuro areaEurope & Central AsiaEurope & Central Asia (excluding high income)Europe & Central Asia (IDA & IBRD countries)European UnionFragile and conflict affected situationsGabonGambia, TheGeorgiaGhanaGrenadaGuatemalaGuineaGuinea-BissauGuyanaHaitiHeavily indebted poor countries (HIPC)High incomeHondurasIBRD onlyIDA & IBRD totalIDA blendIDA onlyIDA totalIndiaIndonesiaIraqJamaicaJordanKenyaKorea, Dem. People’s Rep.Kyrgyz RepublicLao PDRLatin America & Caribbean Latin America & Caribbean (excluding high income)Latin America & the Caribbean (IDA & IBRD countries)Least developed countries: UN classificationLebanonLesothoLiberiaLow incomeLower middle incomeMacao SAR, ChinaMacedonia, FYRMadagascarMalawiMaldivesMaliMauritaniaMauritiusMexicoMiddle East & North AfricaMiddle East & North Africa (excluding high income)Middle East & North Africa (IDA & IBRD countries)MoldovaMongoliaMoroccoMozambiqueMyanmarNamibiaNepalNicaraguaNigerNigeriaOECD membersOther small statesPacific island small statesPakistanPanamaPapua New GuineaParaguayPeruPhilippinesRomaniaRwandaSamoaSao Tome and PrincipeSenegalSeychellesSierra LeoneSmall statesSolomon IslandsSomaliaSouth AsiaSouth Asia (IDA & IBRD)South SudanSri LankaSt. LuciaSt. Vincent and the GrenadinesSub-Saharan Africa Sub-Saharan Africa (excluding high income)Sub-Saharan Africa (IDA & IBRD countries)SudanSurinameSwazilandSyrian Arab RepublicTajikistanTanzaniaThailandTimor-LesteTogoTongaTunisiaTurkeyUgandaUpper middle incomeUruguayUzbekistanVenezuela, RBVietnamWest Bank and GazaWorldYemen, Rep.ZambiaZimbabwe

Zeitlinie:

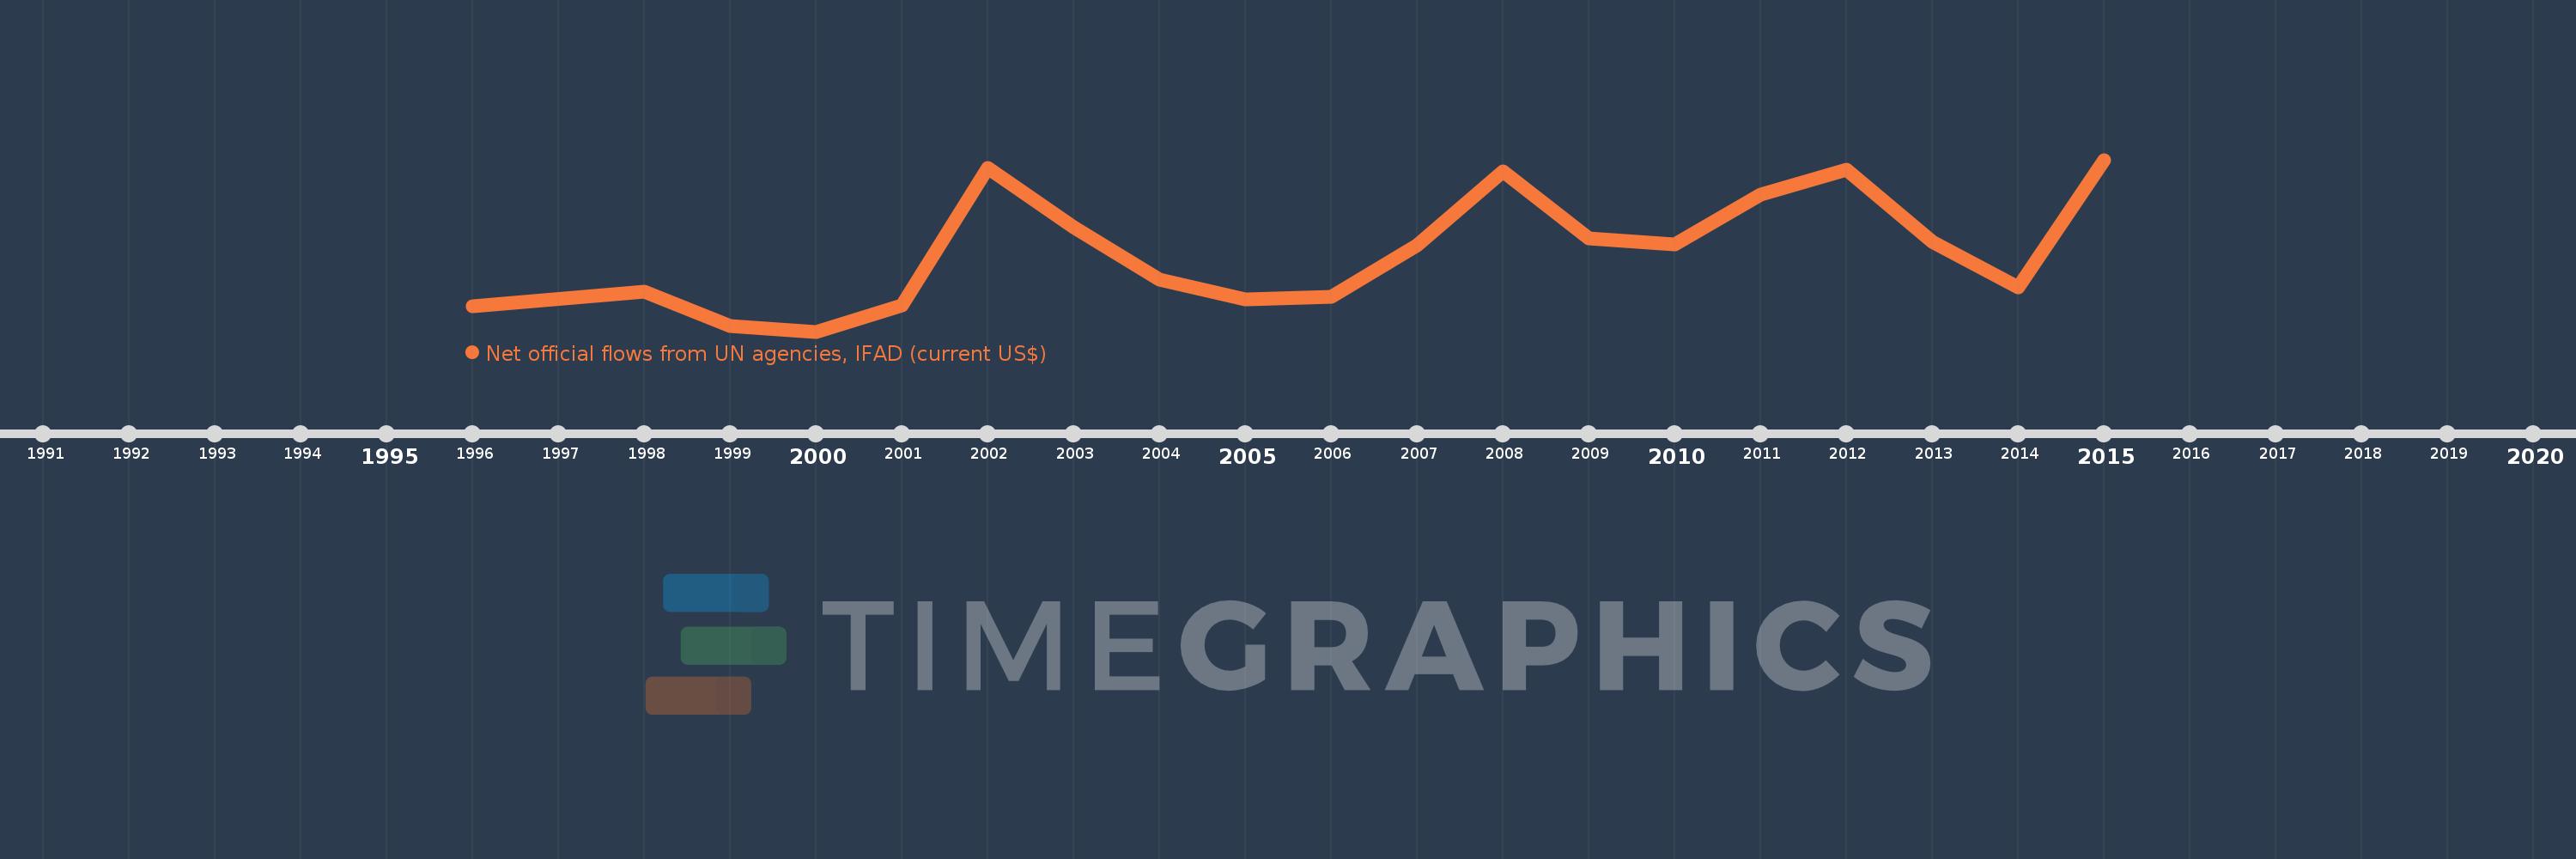
Diese Zeitleiste vorliegt die Graphik ab 1996 J. bis 2015 J. Eritrea. Die Angaben bis 1995 J. sind nicht vorhanden. Die Zahl aktueller Beobachtungen nach Daten: 19.

Die Quelle (Bezeichnung):

Kennzahlen der Weltentwicklung

Die Quelle (Einrichtung):

Development Assistance Committee of the Organisation for Economic Co-operation and Development, Geographical Distribution of Financial Flows to Developing Countries, Development Co-operation Report, and International Development Statistics database. Data are available online at: www.oecd.org/dac/stats/idsonline.

Kategorien:

Aid Effectiveness

Es wurde aktualisiert:

23 Apr 2017 Jahr

Kennzahlen der Wertänderungen vom Jahr zum Jahr

im Durchschnitt:
2.193 Mln.
Minimum:
60.0 Tsnd.
1 Jan 2000 Jahr
Maximum:
4.65 Mln.
1 Jan 2015 Jahr
Zum Datum der Beobachtung
Wert
Absolute Veränderung
Die Veränderung bezüglich dem vorherigen Wert
1 Jan 1996 Jahr
730.0 Tsnd.
+730.0 Tsnd.
0.0%
1 Jan 1998 Jahr
1.13 Mln.
+400.0 Tsnd.
54.79%
1 Jan 1999 Jahr
210.0 Tsnd.
-920.0 Tsnd.
-81.42%
1 Jan 2000 Jahr
60.0 Tsnd.
-150.0 Tsnd.
-71.43%
1 Jan 2001 Jahr
770.0 Tsnd.
+710.0 Tsnd.
1.18 Tsnd.%
1 Jan 2002 Jahr
4.43 Mln.
+3.66 Mln.
475.32%
1 Jan 2003 Jahr
2.85 Mln.
-1.58 Mln.
-35.67%
1 Jan 2004 Jahr
1.45 Mln.
-1.4 Mln.
-49.12%
1 Jan 2005 Jahr
930.0 Tsnd.
-520.0 Tsnd.
-35.86%
1 Jan 2006 Jahr
990.0 Tsnd.
+60.0 Tsnd.
6.45%
1 Jan 2007 Jahr
2.37 Mln.
+1.38 Mln.
139.39%
1 Jan 2008 Jahr
4.35 Mln.
+1.98 Mln.
83.54%
1 Jan 2009 Jahr
2.54 Mln.
-1.81 Mln.
-41.61%
1 Jan 2010 Jahr
2.39 Mln.
-150.0 Tsnd.
-5.91%
1 Jan 2011 Jahr
3.73 Mln.
+1.34 Mln.
56.07%
1 Jan 2012 Jahr
4.39 Mln.
+660.0 Tsnd.
17.69%
1 Jan 2013 Jahr
2.45 Mln.
-1.94 Mln.
-44.19%
1 Jan 2014 Jahr
1.25 Mln.
-1.2 Mln.
-48.98%
1 Jan 2015 Jahr
4.65 Mln.
+3.4 Mln.
272.0%

Bewertung der Länder gemäß mit laufender Statistik nach Jahren